
基于多源数据的318国道川藏段旅游线路雨涝危险性分析
|
余云云(1998-),女,博士研究生,研究方向为灾后人文重建。E-mail: stellayun@163.com |
收稿日期: 2023-09-12
修回日期: 2023-10-18
网络出版日期: 2024-01-10
基金资助
四川大学研究基金(SKSYL2022-04)
四川大学区域历史与边疆学学科群项目
四川省教学改革项目(JG2021-391)
四川大学教学改革项目(SCU8115)
The analysis of rainstorm and flooding hazard of tourism routesalong the Sichuan-Tibet section of National Highway 318 based on multisource data
Received date: 2023-09-12
Revised date: 2023-10-18
Online published: 2024-01-10
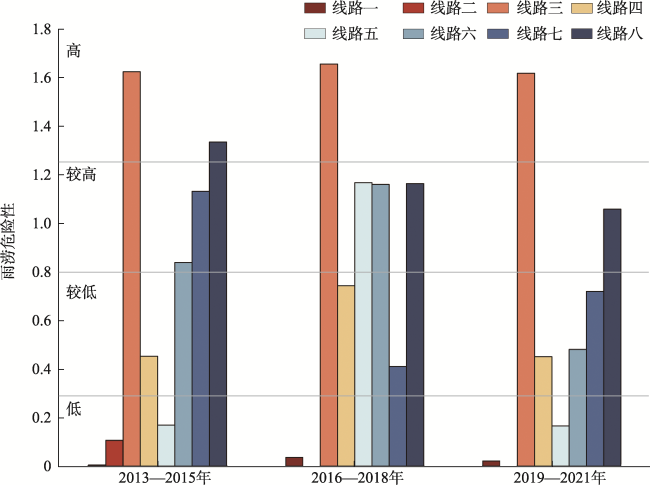
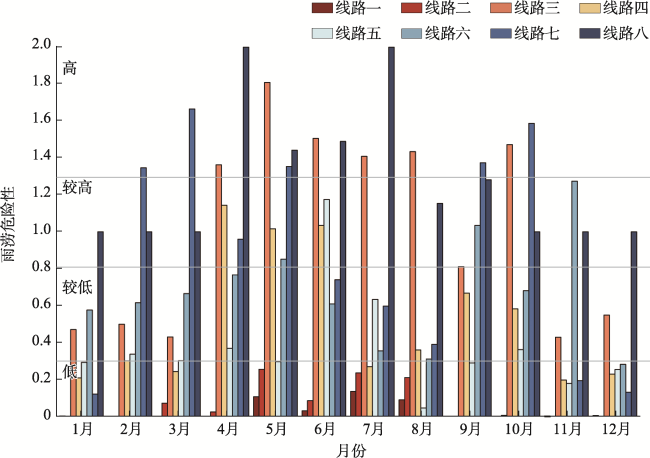
318国道川藏段是中国著名的旅游廊道和典型的灾害高发区,加强沿线主要旅游线路的雨涝危险性研究对提升沿线旅游业应对自然灾害能力具有重要意义。本研究运用基于密度的层次聚类(Hierarchical Density-Based Spatial Clustering of Applications with Noise,HDBSCAN)从2013—2021年21 125条游客轨迹中提取出318国道川藏段主要旅游线路,分析了主要旅游线路的雨涝危险性。结果表明:(1)318国道川藏段的主要旅游线路有8条,线路二(山南市贡嘎县—拉萨市达孜区)和线路五(雅安市石棉县—甘孜州康定市)是典型的跨市域旅游线路。(2)2019—2021年川藏段沿线年均降水量比2013—2015年增加0.99 mm,1—12月川藏段沿线的月均降水量增加6.3 mm。2013—2021年川藏段雨涝灾害累计发生频次比991—1949年减少5次,7月达到全年峰值(7.51次),1月、2月和12月为全年低值(0次)。(3)2013—2021年线路三的雨涝危险性等级最高,线路一和线路二的雨涝危险性等级最低。(4)线路一和线路二在1—12月为低雨涝危险性线路,线路三、线路七和线路八在5月为高雨涝危险性线路。
余云云 , 陈佳淇 , 王圣斌 , 冯冰 , 刘俊 . 基于多源数据的318国道川藏段旅游线路雨涝危险性分析[J]. 中国生态旅游, 2023 , 13(5) : 836 -852 . DOI: 10.12342/zgstly.20230158
The Sichuan-Tibet section of National Highway 318 is a famous tourism corridor and a typical disaster prone area in China. Strengthening the study of heavy rainstorm and the risk of secondary derivative disasters triggered by it in this region is of great significance to comprehensively improve the ability of the tourism industry to cope with natural disasters along the route. In this paper, the Hierarchical Density-Based Spatial Clustering of Applications with Noise (HDBSCAN) model was used to extract the main tourism routes along the Sichuan- Tibet section of the National Highway 318 from 21 125 tourist trajectories from 2013 to 2021, and the rainstorm and flood hazard on the main tourism routes were analyzed. The results show that, (1) there are eight main tourism routes on the Sichuan-Tibet section of the National Highway 318. Route 2 (Gongga County, Shannan City to Dazi District, Lhasa City) and Route 5 (Shimian County, Ya’an to Kangding City, Ganzi Tibetan Autonomous Prefecture) are typical cross-city tourist routes. (2) The average annual precipitation along the Sichuan-Tibet section in 2019-2021 is 0.99 mm higher than that in 2013-2015, and the average precipitation in January-December is 6.3 mm higher. The cumulative frequency of rainstorm and flooding along the Sichuan-Tibet section is 5 times lower than that in the period of 991-1949, and the annual peak is reached in July (7.51 times), with January, February and December is the annual low value (0 times). (3) Route 3 has the highest risk of rainstorm and flooding hazard for 2013-2021, and Route 1 and Route 2 have the lowest level of rainstorm and flooding hazard. (4) Route 1 and Route 2 have the lowest rainstorm and flood hazard risk from January to December, and Route 3, Route 7, and Route 8 have the highest rainstorm and flood hazard risk in May.
表1 2013—2021年川藏段主要旅游线路基本情况Tab. 1 Key information of main tourism routes on the Sichuan-Tibet section from 2013 to 2021 |
| 线路 | 起点 | 终点 | 停留点个数/个 | 平均行程长度/km | 平均耗时/h | 最远长度/km | 最长耗时/h |
|---|---|---|---|---|---|---|---|
| 线路一 | 拉萨市城关区 | 拉萨市当雄县 | 25 | 66.29 | 4.69 | 115.79 | 14.59 |
| 线路二 | 山南市贡嘎县 | 拉萨市达孜区 | 200 | 81.66 | 4.85 | 120.74 | 22.79 |
| 线路三 | 甘孜州巴塘县 | 甘孜州理塘县 | 175 | 66.59 | 8.65 | 120.88 | 23.55 |
| 线路四 | 雅安市天全县 | 雅安市石棉县 | 81 | 69.14 | 5.64 | 118.87 | 12.26 |
| 线路五 | 雅安市石棉县 | 甘孜州康定市 | 1 756 | 83.17 | 11.38 | 119.88 | 23.99 |
| 线路六 | 甘孜州巴塘县 | 甘孜州理塘县 | 819 | 97.74 | 8.63 | 120.43 | 22.85 |
| 线路七 | 林芝市波密县 | 林芝市波密县 | 55 | 72.56 | 6.23 | 107.53 | 13.70 |
| 线路八 | 林芝市米林县 | 林芝市巴宜区 | 149 | 81.56 | 6.64 | 120.39 | 23.95 |
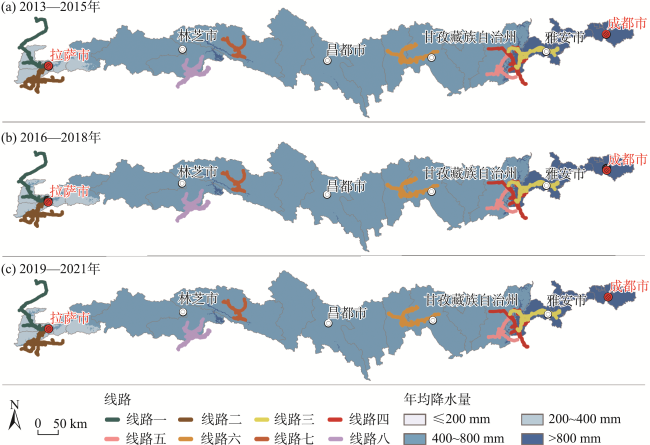
图1 2013—2021年川藏段沿线的年均降水量空间分布Fig. 1 Spatial distribution of average annual precipitation along the Sichuan-Tibet section from 2013 to 2021 |
表2 2013—2021年川藏段沿线降水量及不同降水量等级的占比Tab. 2 Precipitation and the ratio of different precipitation levels along the Sichuan-Tibet section from 2013 to 2021 |
| 类别 | 2013—2015年 | 2016—2018年 | 2019—2021年 |
|---|---|---|---|
| 平均值/mm | 644.56 | 660.51 | 645.55 |
| 最大值/mm | 1 817.33 | 1 671.10 | 1 737.13 |
| 最小值/mm | 275.63 | 320.30 | 287.47 |
| ≤200 mm的区域占比/% | 0.00 | 0.00 | 0.00 |
| 200~400 mm的区域占比/% | 4.68 | 2.10 | 4.52 |
| 400~800 mm的区域占比/% | 85.13 | 86.13 | 85.64 |
| >800 mm的区域占比/% | 10.19 | 11.77 | 9.84 |
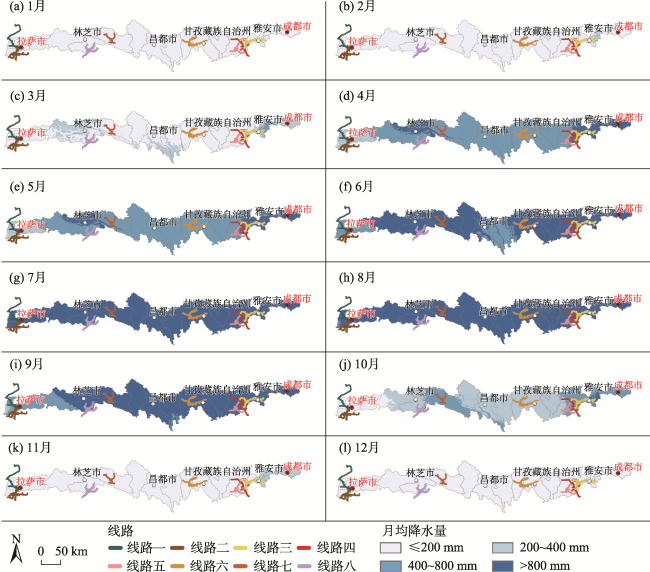
图2 1—12月川藏段沿线的月均降水量空间分布Fig. 2 Spatial distribution of monthly average precipitation along the Sichuan-Tibet section from January to December |
表3 1—12月川藏段沿线降水量及不同降水量等级的占比Tab. 3 Precipitation and the ratio of different precipitation levels along the Sichuan-Tibet section from January to December |
| 类别 | 1月 | 2月 | 3月 | 4月 | 5月 | 6月 | 7月 | 8月 | 9月 | 10月 | 11月 | 12月 |
|---|---|---|---|---|---|---|---|---|---|---|---|---|
| 平均值 | 41.36 | 67.37 | 167.86 | 341.88 | 648.25 | 1 130.86 | 1 458.13 | 1 203.53 | 1 072.71 | 362.47 | 72.35 | 47.46 |
| 最大值 | 185.11 | 251.33 | 514.89 | 890.11 | 1 315.33 | 2 568.67 | 3 976.67 | 4 587.44 | 2 613.25 | 914.89 | 405.78 | 211.50 |
| 最小值 | 0.22 | 0.67 | 21.11 | 60.89 | 187.67 | 442.56 | 1028.22 | 747.44 | 336.13 | 62.67 | 9.67 | 1.13 |
| ≤200 mm占比/% | 100.00 | 98.61 | 77.65 | 9.08 | 0.08 | 0.00 | 0.00 | 0.00 | 0.00 | 11.14 | 93.46 | 99.95 |
| 200~400 mm占比/% | 0.00 | 1.39 | 20.77 | 70.89 | 6.57 | 0.00 | 0.00 | 0.00 | 0.63 | 59.13 | 6.54 | 0.05 |
| 400~800 mm占比/% | 0.00 | 0.00 | 1.58 | 19.29 | 75.34 | 17.53 | 0.00 | 0.26 | 14.04 | 28.46 | 0.00 | 0.00 |
| >800 mm占比/% | 0.00 | 0.00 | 0.00 | 0.74 | 18.01 | 82.47 | 100.00 | 99.74 | 85.33 | 1.27 | 0.00 | 0.00 |
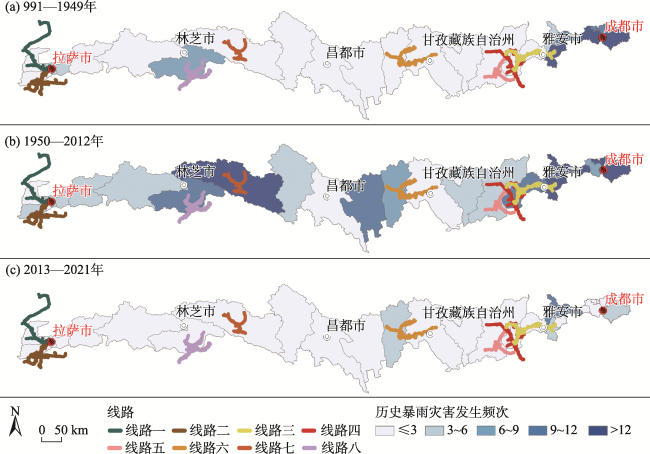
图3 川藏段沿线地区的历史暴雨灾害空间分布Fig. 3 Spatial distribution of historical rainstorm disasters along the Sichuan-Tibet section |
表4 不同阶段的历史暴雨灾害发生频次及不同频次等级的区县占比Tab. 4 Frequency and the ratio of districts and counties with different frequency levels of historical rainstorm disasters at different stages |
| 类别 | 991—1949年 | 1950—2012年 | 2013—2021年 |
|---|---|---|---|
| 平均值/次 | 6.67 | 12.26 | 1.67 |
| 最大值/次 | 25 | 39 | 11 |
| 最小值/次 | 0 | 1 | 0 |
| ≤3次的区县占比/% | 51.85 | 11.11 | 81.48 |
| 3~6次的区县占比/% | 11.11 | 29.63 | 11.11 |
| 6~9次的区县占比/% | 3.70 | 7.41 | 0.00 |
| 9~12次的区县占比/% | 14.82 | 14.81 | 7.41 |
| >12次的区县占比/% | 18.52 | 37.04 | 0.00 |
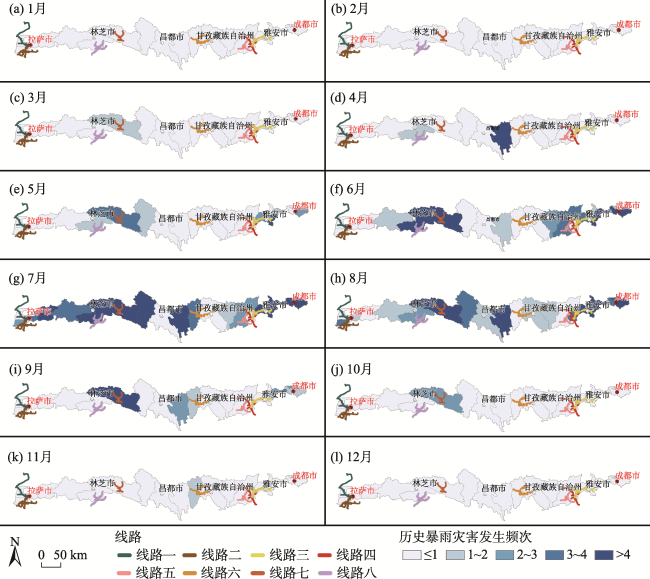
图4 1—12月川藏段沿线地区的历史暴雨灾害空间分布格局Fig. 4 Spatial distribution of historical rainstorm disasters along the Sichuan-Tibet section from January to December |
表5 1—12月的历史暴雨灾害发生频次及不同频次的区县占比Tab. 5 Frequency and the ratio of districts and counties with different frequency levels of historical rainstorm disasters from January to December |
| 类别 | 1月 | 2月 | 3月 | 4月 | 5月 | 6月 | 7月 | 8月 | 9月 | 10月 | 11月 | 12月 |
|---|---|---|---|---|---|---|---|---|---|---|---|---|
| 平均值/次 | 0.00 | 0.04 | 0.26 | 0.52 | 1.56 | 3.26 | 7.63 | 5.41 | 1.33 | 0.30 | 0.07 | 0.00 |
| 最大值/次 | 0 | 1 | 2 | 5 | 8 | 12 | 19 | 16 | 7 | 3 | 2 | 0 |
| 最小值/次 | 0 | 0 | 0 | 0 | 0 | 0 | 0 | 0 | 0 | 0 | 0 | 0 |
| ≤1次的区县占比/% | 100.00 | 100.00 | 96.30 | 92.60 | 66.67 | 40.74 | 14.81 | 18.52 | 59.26 | 96.30 | 96.30 | 100.00 |
| 1~2次的区县占比/% | 0.00 | 0.00 | 3.70 | 3.70 | 14.81 | 14.81 | 7.41 | 22.22 | 14.81 | 0.00 | 3.70 | 0.00 |
| 2~3次的区县占比/% | 0.00 | 0.00 | 0.00 | 0.00 | 7.41 | 11.11 | 7.41 | 3.71 | 18.53 | 3.70 | 0.00 | 0.00 |
| 3~4次的区县占比/% | 0.00 | 0.00 | 0.00 | 0.00 | 3.70 | 7.41 | 11.11 | 14.81 | 3.70 | 0.00 | 0.00 | 0.00 |
| >4次的区县占比/% | 0.00 | 0.00 | 0.00 | 3.70 | 7.41 | 25.93 | 55.56 | 40.74 | 3.70 | 0.00 | 0.00 | 0.00 |
| [1] |
秦大河. 中国极端天气气候事件和灾害风险管理与适应国家评估报告[M]. 北京: 科学出版社, 2015.
[
|
| [2] |
王松江, 盘大滨. 基于集对分析的自然灾害应急管理能力评估方法研究[J]. 自然灾害学报, 2023, 32(4): 104-116.
[
|
| [3] |
CRED. EM-DAT: The International Disaster Database[DB/OL]. (2023-05-23). https://www.emdat.be/.
|
| [4] |
|
| [5] |
IPCC. Climate change 2022: Mitigation of Climate Change[M]. Cambridge: Cambridge University Press, 2022.
|
| [6] |
|
| [7] |
|
| [8] |
中华人民共和国国家发展和改革委员会. “十四五”国家应急体系规划[EB/OL]. (2022-03-25). [2023-09-05]. https://www.ndrc.gov.cn/fggz/fzzlgh/gjjzxgh/202203/t20220325_1320218.html.
[National Development and Reform Commission. The construction of its emergency management system over the 14th Five-Year Plan period (2021-2025) [EB/OL]. (2022-03-25). [2023-09-05]. https://www.ndrc.gov.cn/fggz/fzzlgh/gjjzxgh/202203/t20220325_1320218.html.]
|
| [9] |
《第四次气候变化国家评估报告》编写委员会. 第四次气候变化国家评估报告[M]. 北京: 科学出版社, 2022.
[Compilation Committee of the Fourth National Assessment Report on Climate Change. Fourth National Assessment Report on Climate Change[M]. Beijing: Science Press, 2022.]
|
| [10] |
赵凯旭, 王建明, 闫茜, 等. 西安市老城区暴雨内涝模拟及其灾害风险评估[J]. 自然灾害学报, 2023, 32(4): 1-12.
[
|
| [11] |
姬兴杰, 丁亚磊, 李凤秀, 等. 不同重现期下河南洛河上游暴雨山洪灾害风险评估[J]. 自然灾害学报, 2022, 31(3): 48-59.
[
|
| [12] |
李国一, 刘家宏, 邵薇薇. 洪涝灾害风险评估与分区研究进展[J]. 水文, 2023, 43(4): 15-20.
[
|
| [13] |
刘家福, 张柏. 暴雨洪灾风险评估研究进展[J]. 地理科学, 2015, 35(3): 346-351.
[
|
| [14] |
叶翔宇, 郭禹含, 梁廖逢, 等. 川藏交通廊道暴雨山洪灾害风险评估[J]. 自然灾害学报, 2023, 32(4): 48-60.
[
|
| [15] |
刘浩龙, 葛全胜, 席建超. 区域旅游资源的灾害风险评估: 以内蒙古克什克腾旗为例[J]. 资源科学, 2007, 29(1): 118-125.
[
|
| [16] |
王晓峰, 洪媛. 翠华山景区暴雨灾害游客风险感知差异性评价[J]. 西北大学学报(自然科学版), 2017, 47(6): 916-922, 928.
[
|
| [17] |
李自强, 席建超, 张瑞英. 滇藏公路沿线旅游安全风险评价[J]. 山地学报, 2022, 40(5): 753-763.
[
|
| [18] |
|
| [19] |
徐澯, 宫阿都, 包文轩. 基于机器学习的不可移动文物暴雨灾害风险评估: 以山西省为例[J]. 自然灾害学报, 2023, 32(4): 25-35.
[
|
| [20] |
叶欣梁, 温家洪, 邓贵平. 基于多情景的景区自然灾害风险评价方法研究: 以九寨沟树正寨为例[J]. 旅游学刊, 2014, 29(7): 47-57.
[
|
| [21] |
褚万年, 张伟, 吴雪娇, 等. 公众对极端暴雨和洪水灾害的风险感知与保护行为关系研究: 以新疆阿克苏地区为例[J]. 灾害学, 2022, 37(3): 227-234.
[
|
| [22] |
周轶, 陈柳彤, 黄靖玲, 等. 典型降雨情景下北京市十渡镇山洪灾害风险评估[J]. 灾害学, 2021, 36(3): 97-102.
[
|
| [23] |
菊春燕, 贾永刚, 潘玉英, 等. 基于分形理论的旅游景区地质灾害危险性评估: 以青岛崂山为例[J]. 自然灾害学报, 2013, 22(6): 85-95.
[
|
| [24] |
|
| [25] |
|
| [26] |
彭守璋. 中国1km分辨率逐月降水量数据集(1901-2021)[DB/OL]. 时空三极环境大数据平台, 10.5281/zenodo.3185722.
[
|
| [27] |
|
| [28] |
|
| [29] |
温克刚, 詹兆渝. 中国气象灾害大典: 四川卷[M]. 北京: 气象出版社, 2006.
[
|
| [30] |
温克刚, 刘光轩. 中国气象灾害大典: 西藏卷[M]. 北京: 气象出版社, 2007.
[
|
| [31] |
刘俊, 杨璐瑜, 王胜宏, 等. 气候变化与登山旅游: 基于游客大数据的分析与模拟[J]. 旅游学刊, 2022, 37(9): 141-154.
[
|
| [32] |
王红霞, 柳小妮, 李纯斌, 等. 甘肃省近42年降水量变化时空分布格局分析[J]. 中国农业气象, 2013, 34(4): 384-389.
[
|
| [33] |
郭凌曜, 廖玉芳, 李晶, 等. 湖南历史风雹灾害序列构建及其变化特征[J]. 灾害学, 2018, 33(2): 122-127.
[
|
| [34] |
|
| [35] |
袁韵, 徐戈, 陈晓红, 等. 城市交通拥堵与空气污染的交互影响机制研究: 基于滴滴出行的大数据分析[J]. 管理科学学报, 2020, 23(2): 54-73.
[
|
| [36] |
|
| [37] |
裘江南, 徐雪冬, 谷文静, 等. 突发公共卫生事件下不同人格特质公众的信息需求比较分析[J/OL]. 数据分析与知识发现, 1-17. [2023-12-04]. http://kns.cnki.net/kcms/detail/10.1478.G2.20230919.0918.002.html.
[
|
| [38] |
杨云佳, 史兴民. 基于微博大数据的“一路象北”事件社会感知与时空格局研究[J]. 地理与地理信息科学, 2023, 39(4): 10-16.
[
|
| [39] |
|
| [40] |
HDBSCAN. How HDBSCAN Works[EB/OL]. (2023-09-10). https://hdbscan.readthedocs.io/en/latest/how_hdbscan_works.html.
|
| [41] |
陈科. 旅游可持续发展与土地可持续利用耦合协调研究: 以四川省德阳市罗江区为例[D]. 成都: 四川大学, 2019.
[
|
| [42] |
刘俊, 彭聪, 于书逸, 等. 成都市酒店时空分布及其影响因素研究[J]. 地域研究与开发, 2022, 41(6): 55-61.
[
|
/
| 〈 |
|
〉 |