期刊
文章
图表
检索
EN
中文
首页
关于期刊
期刊介绍
数据库收录
期刊荣誉
出版政策
编委会
投稿指南
投稿须知
栏目设置
在线期刊
当期目录
优先出版
过刊浏览
推荐文章
专题
按栏目浏览
阅读排行
下载排行
引用排行
E-mail Alert
RSS
期刊订阅
广告合作
联系我们
EN
中文
更多选择
期刊
DOI
请选择
Area Development and Policy
Cities
Journal of Arid Land
Regional Sustainability
Resources Environment and Sustainability
冰川冻土
长江流域资源与环境
沉积学报
城市学刊
城市研究
地理科学
地理科学进展
地理学报
地理学报(英文版)
地理学与可持续性(英文)
地理研究
地理与地理信息科学
地球科学进展
地球信息科学学报
地域研究与开发
地质与资源
第四纪研究
风景园林
干旱区地理
干旱区研究
干旱区资源与环境
高原气象
贵州师范大学学报(自然科学版)
国际灾害风险科学学报(英文)
国情快报·科普版
国情快报·政策版
国土资源科技管理
寒旱区科学
湖泊科学
湖南城市学院学报(自然科学版)
湖南师范大学自然科学学报
湖南文理学院学报(自然科学版)
华南地理学报
黄金科学技术
经济地理
历史地理
历史地理研究
旅游论坛
旅游学刊
全球变化数据仓储电子杂志(中英文)
全球变化数据学报
热带地理
人文地理
山地科学学报(英文版)
山地学报
湿地科学
时空信息学报
世界地理研究
天然气地球科学
土壤与作物
亚热带资源与环境学报
遥感技术与应用
中国地理科学(英文版)
中国沙漠
中国生态旅游
中国土地科学
资源开发与市场
资源科学
资源与生态学报
自然资源情报
自然资源信息化
自然资源学报
起始年
结束年
请选择
1934
1935
1936
1937
1938
1939
1940
1941
1942
1943
1944
1945
1946
1947
1948
1949
1950
1951
1952
1953
1954
1955
1956
1957
1958
1959
1960
1961
1962
1963
1964
1965
1966
1967
1968
1969
1970
1971
1972
1973
1974
1975
1976
1977
1978
1979
1980
1981
1982
1983
1984
1985
1986
1987
1988
1989
1990
1991
1992
1993
1994
1995
1996
1997
1998
1999
2000
2001
2002
2003
2004
2005
2006
2007
2008
2009
2010
2011
2012
2013
2014
2015
2016
2017
2018
2019
2020
2021
2022
2023
2024
2025
2026
请选择
2026
2025
2024
2023
2022
2021
2020
2019
2018
2017
2016
2015
2014
2013
2012
2011
2010
2009
2008
2007
2006
2005
2004
2003
2002
2001
2000
1999
1998
1997
1996
1995
1994
1993
1992
1991
1990
1989
1988
1987
1986
1985
1984
1983
1982
1981
1980
1979
1978
1977
1976
1975
1974
1973
1972
1971
1970
1969
1968
1967
1966
1965
1964
1963
1962
1961
1960
1959
1958
1957
1956
1955
1954
1953
1952
1951
1950
1949
1948
1947
1946
1945
1944
1943
1942
1941
1940
1939
1938
1937
1936
1935
1934
卷
期
作者
作者单位
检索结果
期刊
Loading ...
出版年
Loading ...
表3 TERGM实证结果
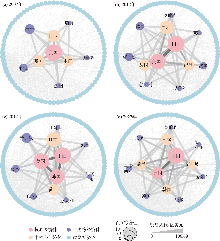
图6
全球光刻机贸易网络核心—边缘结构分布
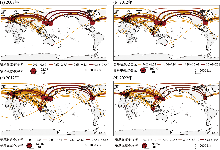
图5
全球光刻机贸易网络的空间结构
注:本图基于自然资源部标准地图服务网站下载的审图号为GS(2016)1666号的标准地图制作,底图边界无修改。
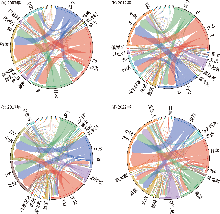
图4
全球光刻机贸易联系强度
注:图中数据单位为亿美元。
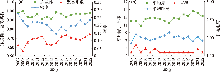
图3
全球光刻机贸易网络中心度的核密度
图2
全球光刻机贸易网络的整体结构特征
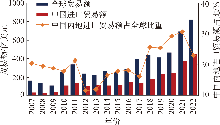
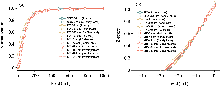
图1
全球光刻机贸易额及中国进口占比
表2 TERGM模型外生因素变量
表1 TERGM模型统计量
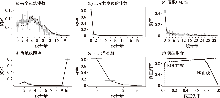
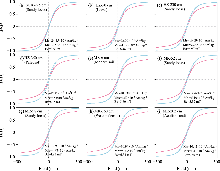
图7
TERGM拟合优度检验结果
注:图a~e中黑色实线显示实际网络的统计属性,箱形图是由仿真模型推导出的网络特征。当黑线更接近箱形图的中心时,模型拟合更好。箱型图上下代表四分位数,中间短线代表中位数,小方框代表均值。
表4 稳健性检验结果
Table S1 Linear regression equations for calculating lithogenic (χ
0
) and pedogenic (χ
pedo
) magnetic susceptibility components
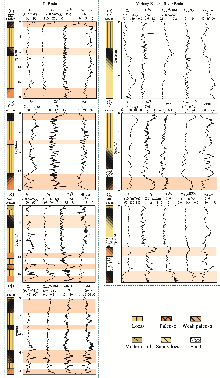
Figure S10
Variations of representative aeolian sections and climatic indices from (a-f) the Chinese Loess Plateau and (g-i) desert periphery of non-mountain-basin system. a: YC section (Liu et al.,
2004
; Liu et al.,
2005
), b: XF section (Liu et al.,
1992
), c: YX section (Xia et al.,
2014
), d: YB section (Liu et al.,
2004
; Liu et al.,
2005
), e: LGT section (Jia et al.,
2008
), f: PC section (Sun and Liu,
2000
), g: KY section (Fan et al.,
2023
), h: ZL section (Wei et al.,
2013
), i: XN section (Zhao,
2016
).
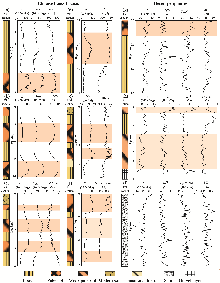
Figure S9
Variations of representative aeolian sections and climatic indices from (a-d) the Ili basin and (e-g) Yarlung Zangbo River basin on the southern Tibetan Plateau of mountain-basin system. a: ZKT section (Jia
et al
.,
2012
), b: TLD section (Liu
et al
.,
2012
), c: AXK section (Jia
et al
.,
2012
; Xia
et al
.,
2010
), d: SW section (Li
et al
.,
2015
), e-g: SGX section, HZ section, MR section (this study).
Figure S8
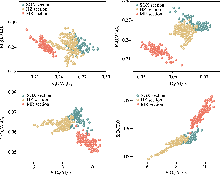
Scatter plots of element ratios of the aeolian deposits from the SGX, HZ, and MR sections
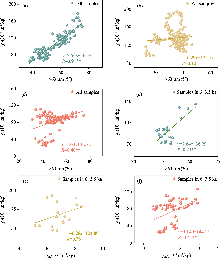
Figure S7
Correlations between magnetic parameters and sedimentological proxies. (a-c) Magnetic susceptibility (χ
lf
) versus the >63 μm fraction for all samples in the SGX, HZ, and MR sections, respectively. (d) χ
lf
versus the >63 μm fraction for samples dated to 6.0-3.5 ka in the SGX section. (e-f) χ
lf
versus frequency-dependent magnetic susceptibility (χ
fd
) for samples dated to 6.0-3.5 ka in the HZ and MR sections, respectively. Pearson correlation coefficients (
R
) and their statistical significance (**
p
< 0.01) are indicated.
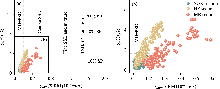
Figure S6
Magnetic grain size characteristics of aeolian deposits from the SGX, HZ, and MR sections. (a) Dearing plots of magnetic parameters for all samples from the SGX, HZ, and MR sections, showing the distribution of magnetic grain sizes and domain states. The fields for multi-domain (MD), stable single domain (SSD), pseudo-single-domain (PSD), and superparamagnetic (SP) grains are shown for reference. (b) Enlargement of the area outlined by the rectangle in (a).
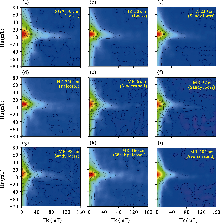
Figure S5
Additional FORC diagrams for samples from the (a) SGX, (b-d) HZ, and (e-i) MR sections. These data supplement the representative samples shown in
Figure 3
of the main text.
Figure S4
Isothermal remanent magnetization (IRM) curves for representative samples from the SGX, HZ, and MR sections. (a) IRM acquisition curves; (b) backfield curves.
Figure S3
Additional hysteresis loops for samples from the (a) SGX, (b-d) HZ, and (e-i) MR sections. These data supplement the representative samples in
Figure 3
of the main text. Red curves indicate paramagnetic correction; cyan curves represent uncorrected data.
跳至
页
第1页
共8849页
共176968条记录
首页
上一页
下一页
尾页