
旅游发展对CO2排放的复杂影响:不同类型城市的比较分析
|
张燕(1985-),女,副教授,研究方向为低碳旅游和旅游经济。E-mail: zhangyan140701@126.com |
收稿日期: 2024-06-24
修回日期: 2024-08-14
网络出版日期: 2025-01-03
基金资助
国家自然科学基金项目(72742037)
广西高校中青年教师科研基础能力提升项目(2024KY0835)
Complex impacts of tourism development on CO2 emissions: A comparative analysis of different types of cities in China
Received date: 2024-06-24
Revised date: 2024-08-14
Online published: 2025-01-03
张燕 , 章杰宽 . 旅游发展对CO2排放的复杂影响:不同类型城市的比较分析[J]. 中国生态旅游, 2024 , 14(4) : 738 -755 . DOI: 10.12342/zgstly.20240161
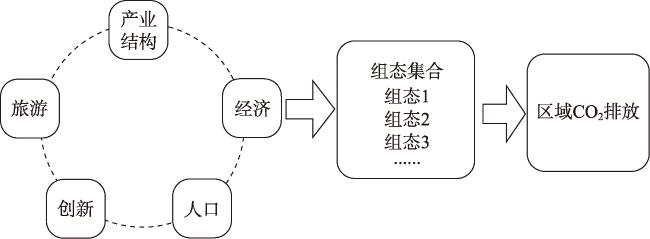
The relationship between tourism development and CO2 emissions has attracted considerable interest from researchers worldwide under the background of global climate governance and the claim of China’s “dual carbon” goal. However, existing studies tend to concentrate solely on tourism without examining the broader impact of the socio-economic system in which it resides. From a holistic perspective, this article uses fuzzy-set qualitative comparative analysis methods and necessary condition analysis based on a total of 93 cases from 31 different types of cities in China to reveal the synergistic causal impact of tourism development and various factors such as economic development, industrial structure, innovation capacity and population size on CO2 emissions. The results show that: (1) neither tourism nor other single variable is a necessary or sufficient condition for regional CO2 emissions; (2) there are three patterns driving high CO2 emissions, namely the industry-driven, economy-tourism driven, and population-industry driven; and (3) there are three patterns of low CO2 emissions, namely the low development driven, tourism driven, and economy driven. The article confirms the complex impacts of tourism development and other core conditions on CO2 emissions from configurational perspectives. The article identifies a causal asymmetry in the driving mechanisms of CO2 emissions, i.e., the presence or absence of tourism development may drive either high or low CO2 emissions. Moreover, the article provides a solid theoretical basis for tailoring tourism development to local conditions and promoting tourism’s low-carbon development.
表1 2019年各类型排名前十的城市Tab. 1 Top 10 cities by different categories in 2019 |
| 排名 | 旅游型城市 | 旅游收入/GDP | 污染型城市 | 百万吨CO2 排放(t) | 发达型城市 | 人均GDP(元) | 创新型城市 | 专利授权数量 (个) |
|---|---|---|---|---|---|---|---|---|
| 1 | 丽江 | 2.276 | 上海 | 192.91 | 深圳 | 203 489 | 深圳 | 166 609 |
| 2 | 张家界 | 1.721 | 天津 | 158.47 | 克拉玛依 | 188 857 | 北京 | 131 716 |
| 3 | 西双版纳 | 1.453 | 重庆 | 156.25 | 无锡 | 180 044 | 广州 | 104 813 |
| 4 | 安顺 | 1.451 | 苏州 | 131.57 | 苏州 | 179 174 | 上海 | 100 587 |
| 5 | 德宏 | 1.095 | 鄂尔多斯 | 116.76 | 珠海 | 175 533 | 苏州 | 81 145 |
| 6 | 黔东南 | 1.077 | 唐山 | 107.47 | 鄂尔多斯 | 173 069 | 杭州 | 61 568 |
| 7 | 迪庆 | 1.076 | 石家庄 | 98.04 | 南京 | 165 681 | 东莞 | 60 419 |
| 8 | 甘孜 | 0.931 | 武汉 | 89.44 | 北京 | 164 220 | 佛山 | 58 747 |
| 9 | 池州 | 0.930 | 保定 | 88.83 | 阿拉善 | 163 763 | 天津 | 57 799 |
| 10 | 三亚 | 0.929 | 成都 | 88.54 | 上海 | 157 279 | 南京 | 55 004 |
表2 描述性统计结果和校准点(N=93)Tab. 2 Descriptive statistical results and calibration points (N=93) |
| 变量 | 均值 | 标准差 | 最小值 | 最大值 | 校准 | ||
|---|---|---|---|---|---|---|---|
| 完全隶属 (75%分位数) | 交叉点 (50%分位数) | 完全不隶属 (25%分位数) | |||||
| 人均碳排放 | 11.750 | 14.909 | 2.333 | 66.105 | 9.451 | 7.123 | 5.391 |
| 人均旅游收入 | 17 230 | 13 598 | 1 627 | 66 285 | 21 613 | 13 045 | 8 238 |
| 人均GDP | 73 636 | 44 645 | 10 481 | 180 460 | 108 629 | 69 740 | 31 159 |
| 创新能力 | 22 925 | 32 011 | 5 | 166 609 | 38 025 | 6 697 | 289 |
| 产业结构 | 41.730 | 14.132 | 14.701 | 89.340 | 49.770 | 41.303 | 31.701 |
| 人口 | 775 | 746 | 24 | 3 124 | 1 075 | 744 | 132 |
表3 必要条件分析Tab. 3 Necessary condition analysis |
| 前因变量 | 高CO2排放 | 低CO2排放 | |||
|---|---|---|---|---|---|
| 一致性 | 覆盖度 | 一致性 | 覆盖度 | ||
| 高人均旅游收入 | 0.536 | 0.511 | 0.545 | 0.568 | |
| 低人均旅游收入 | 0.547 | 0.524 | 0.531 | 0.555 | |
| 高人口 | 0.547 | 0.533 | 0.517 | 0.551 | |
| 低人口 | 0.539 | 0.505 | 0.562 | 0.576 | |
| 高人均GDP | 0.676 | 0.657 | 0.405 | 0.430 | |
| 低人均GDP | 0.414 | 0.389 | 0.677 | 0.696 | |
| 高创新能力 | 0.521 | 0.523 | 0.518 | 0.568 | |
| 低创新能力 | 0.569 | 0.519 | 0.565 | 0.563 | |
| 高产业结构 | 0.742 | 0.695 | 0.382 | 0.391 | |
| 低产业结构 | 0.350 | 0.341 | 0.702 | 0.748 | |
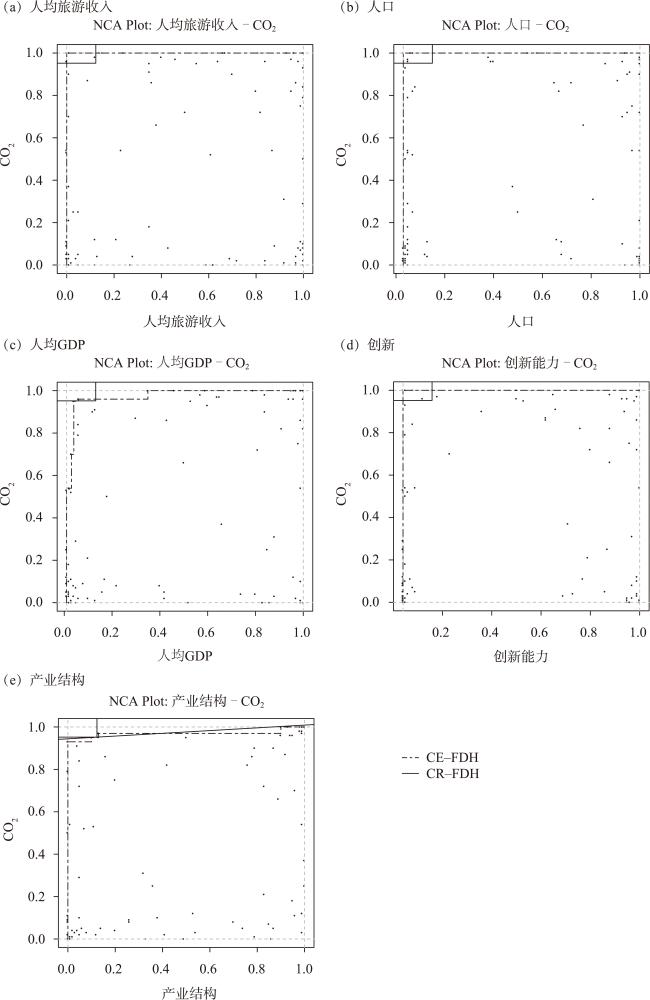
表4 NCA必要性结果Tab. 4 NCA necessity results |
| 前因变量 | 估计方法 | 精确度(%) | 上限 | 范围 | 效应值 | p值 |
|---|---|---|---|---|---|---|
| 人均旅游收入 | CE | 100.0 | 0.000 | 1.000 | 0.000 | 1.000 |
| CR | 100.0 | 0.000 | 1.000 | 0.000 | 1.000 | |
| 人口 | CE | 100.0 | 0.000 | 0.970 | 0.000 | 1.000 |
| CR | 100.0 | 0.000 | 0.970 | 0.000 | 1.000 | |
| 人均GDP | CE | 100.0 | 0.025 | 0.990 | 0.025 | 0.000 |
| CR | 93.5 | 0.044 | 0.990 | 0.044 | 0.000 | |
| 创新能力 | CE | 100.0 | 0.000 | 0.960 | 0.000 | 1.000 |
| CR | 100.0 | 0.000 | 0.960 | 0.000 | 1.000 | |
| 产业结构 | CE | 100.0 | 0.032 | 1.000 | 0.032 | 0.000 |
| CR | 98.9 | 0.024 | 1.000 | 0.024 | 0.000 |
注:CE表示上限包络分析;CR表示上限回归分析。置换检验(Permutation test)为1 000次。 |
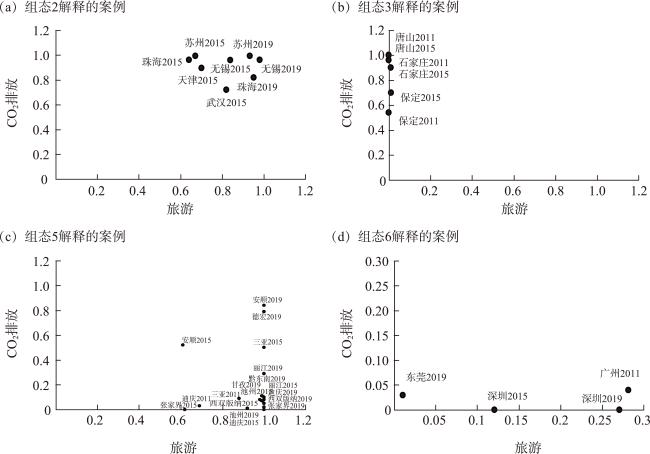
表5 影响CO2排放的组态Tab. 5 Configuration affects CO2 emissions |
| 组态 | 高CO2排放 | 低CO2排放 | |||||
|---|---|---|---|---|---|---|---|
| 组态1 | 组态2 | 组态3 | 组态4 | 组态5 | 组态6 | ||
| 人均旅游收入 | ● | | ● | | |||
| 人均GDP | ● | ● | | | | ● | |
| 创新能力 | | ● | | | | ● | |
| 产业结构 | ● | ● | ● | | | ||
| 人口 | | ● | | | ● | ||
| 一致性 | 0.964 | 0.879 | 0.865 | 0.834 | 0.811 | 0.861 | |
| 原始覆盖度 | 0.303 | 0.242 | 0.178 | 0.415 | 0.314 | 0.140 | |
| 唯一覆盖度 | 0.195 | 0.162 | 0.092 | 0.143 | 0.049 | 0.111 | |
| 代表性案例 | 阿拉善、 克拉玛依、 鄂尔多斯 | 苏州2019、 苏州2015、无锡2019、 无锡2015、 武汉2015、 珠海2015、珠海2019、 天津2015 | 石家庄2015、石家庄2011、 保定2015、 保定2011、唐山2015、 唐山2011 | 德宏2015、 德宏2011、 黔东南2011、黔东南2015、甘孜2015、 张家界2011、西双版纳2011 | 丽江2019、丽江2015、 张家界2019、张家界2015、 安顺2019、安顺2015、 西双版纳2015、西双版纳2019、 池州2019、池州2015、 三亚2015、三亚2011、 迪庆2019、迪庆2015、 迪庆2011、甘孜2019、 黔东南2019、德宏2019、 | 深圳2019、 深圳2015、 东莞2019、 广州2011 | |
| 总体解的一致性 | 0.903 | 0.828 | |||||
| 总体解的覆盖度 | 0.569 | 0.575 | |||||
注:●表示核心条件存在;表示核心条件不存在;●表示边缘条件存在;表示边缘条件不存在。 |
① 限于版面限制,文章未提供稳健性分析结果,感兴趣的读者可以向作者索取。
| [1] |
唐承财, 查建平, 章杰宽, 等. 高质量发展下中国旅游业“双碳” 目标: 评估预测、主要挑战与实现路径[J]. 中国生态旅游, 2021, 11(4): 471-497.
[
|
| [2] |
|
| [3] |
|
| [4] |
|
| [5] |
|
| [6] |
|
| [7] |
|
| [8] |
|
| [9] |
|
| [10] |
章杰宽. 旅游与碳排放: 全球视角与区域比较[J]. 地理研究, 2022, 41(11): 3088-3104.
[
|
| [11] |
|
| [12] |
王凯, 邵海琴, 周婷婷, 等. 基于EKC框架的旅游发展对区域碳排放的影响分析: 基于1995—2015年中国省际面板数据[J]. 地理研究, 2018, 37(4): 742-750.
[
|
| [13] |
|
| [14] |
Chen J, Gao M, Cheng S, et al. County-level CO2 emissions in China[DB/OL]. Figshare Dataset. 2020. https://doi.org/10.6084/m9.figshare.12887213.v3.
|
| [15] |
黄和平, 乔学忠, 张瑾, 等. 绿色发展背景下区域旅游业碳排放时空分异与影响因素研究: 以长江经济带为例[J]. 经济地理, 2019, 39(11): 214-224.
[
|
| [16] |
邵海琴, 王兆峰. 长江经济带旅游业碳排放效率的综合测度与时空分异[J]. 长江流域资源与环境, 2020, 29(8): 1685-1693.
[
|
| [17] |
查建平. 旅游业能源消费、CO2排放及低碳效率评估[J]. 中国人口·资源与环境, 2016, 26(1): 47-54.
[
|
| [18] |
陶玉国, 黄震方, 吴丽敏, 等. 江苏省区域旅游业碳排放测度及其因素分解[J]. 地理学报, 2014, 69(10): 1438-1448.
[
|
| [19] |
王凯, 张淑文, 甘畅, 等. 中国旅游业碳排放效率的空间网络结构及其效应研究[J]. 地理科学, 2020, 40(3): 344-353.
[
|
| [20] |
|
| [21] |
杜运周, 刘秋辰, 程建青. 什么样的营商环境生态产生城市高创业活跃度? 基于制度组态的分析[J]. 管理世界, 2020, 36(9): 141-155.
[
|
| [22] |
|
| [23] |
|
| [24] |
|
| [25] |
|
| [26] |
张燕, 章杰宽. 旅游、经济、能源和二氧化碳排放: 基于东盟的实证分析[J]. 旅游学刊, 2021, 36(12): 26-39.
[
|
| [27] |
|
| [28] |
|
| [29] |
|
| [30] |
|
| [31] |
|
| [32] |
|
| [33] |
|
| [34] |
原嫄, 周洁. 中国省域尺度下产业结构多维度特征及演化对碳排放的影响[J]. 自然资源学报, 2021, 36(12): 3186-3202.
[
|
| [35] |
|
| [36] |
刘志华, 徐军委, 张彩虹. 科技创新、产业结构升级与碳排放效率: 基于省际面板数据的PVAR分析[J]. 自然资源学报, 2022, 37(2): 508-520.
[
|
| [37] |
郭艺, 曹贤忠, 魏文栋, 等. 长三角区域一体化对城市碳排放的影响研究[J]. 地理研究, 2022, 41(1): 181-192.
[
|
| [38] |
|
| [39] |
王兆峰, 汪倩. 长江经济带新型城镇化对旅游业碳排放的门槛效应研究[J]. 长江流域资源与环境, 2022, 31(1): 13-24.
[
|
| [40] |
李菁, 李小平, 郝良峰. 技术创新约束下双重环境规制对碳排放强度的影响[J]. 中国人口·资源与环境, 2021, 31(9): 34-44.
[
|
| [41] |
|
| [42] |
|
| [43] |
|
| [44] |
邵帅, 范美婷, 杨莉莉. 经济结构调整、绿色技术进步与中国低碳转型发展: 基于总体技术前沿和空间溢出效应视角的经验考察[J]. 管理世界, 2022, 38(2): 46-69, 4-10.
[
|
| [45] |
|
| [46] |
|
| [47] |
|
| [48] |
|
| [49] |
洪业应, 向思洁, 陈景信. 重庆市人口规模、结构对碳排放影响的实证研究: 基于STIRPAT模型的分析[J]. 西北人口, 2015, 36(3): 13-17.
[
|
| [50] |
王星, 刘高理. 甘肃省人口规模、结构对碳排放影响的实证分析: 基于扩展的STIRPAT模型[J]. 兰州大学学报(社会科学版), 2014, 42(1): 127-132.
[
|
| [51] |
|
| [52] |
|
| [53] |
|
| [54] |
王少剑, 田莎莎, 蔡清楠, 等. 产业转移背景下广东省工业碳排放的驱动因素及碳转移分析[J]. 地理研究, 2021, 40(9): 2606-2622.
[
|
| [55] |
|
| [56] |
|
/
| 〈 |
|
〉 |