
利益主体视角下省域生态旅游吸引力的驱动因素与路径演化
|
李泓沄(1991-),女,硕士,讲师,研究方向为生态旅游与森林康养。E-mail: 270478598@qq.com |
收稿日期: 2024-06-22
修回日期: 2024-08-10
网络出版日期: 2025-01-03
基金资助
福建省中青年教师教育科研项目(JAT231220)
福建林业职业技术学院森林康养旅游科研创新团队项目(2021LK03)
The driving factors and paths evolution of provincial ecotourism attractiveness from the perspective of stakeholders
Received date: 2024-06-22
Revised date: 2024-08-10
Online published: 2025-01-03
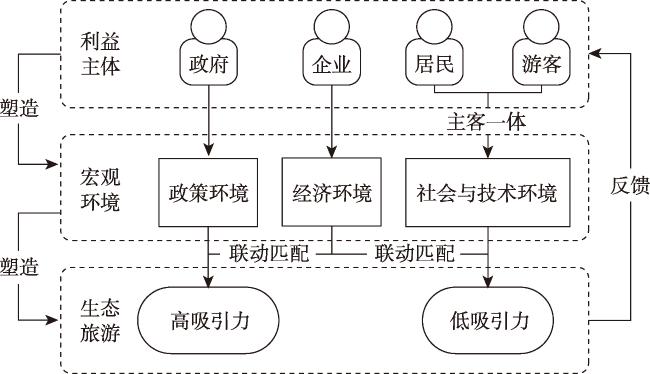
提升生态旅游吸引力是推动生态旅游发展和生态价值实现的重要着力点。文章通过梳理“利益主体-宏观环境-生态旅游吸引力”三者递推关系,描述省域生态旅游吸引力形成的S-PEST-EA逻辑,使用动态fsQCA探索2011—2021年生态旅游吸引力的驱动因素与路径演化。研究表明:(1)生态旅游吸引力由政府、企业、居民与游客所塑造之宏观环境协同驱动而成,具体驱动因素包括表征政策环境的财政支持力度、专项资金投入及森林覆盖率,表征经济环境的餐饮企业数量及住宿企业数量,表征社会与技术环境的城镇化水平及人均互联网端口数。(2)研究周期内共出现13条高水平生态旅游吸引力路径,4条为典型路径,9条为演化路径。其中,R1,即森林覆盖率*餐饮企业数量*住宿企业数量*城镇化水平*人均互联网端口数,解释力最高;R2,即财政支持力度*专项资金投入*森林覆盖率*餐饮企业数量*住宿企业数量*~城镇化水平,演化路径最多。(3)研究周期内共19个省域实现高水平生态旅游吸引力。四川、湖南最早实现,所在路径均为R2及其演化路径;福建连续保持时间最久,所在路径均为R1及其演化路径。文章借助PEST模型限定利益主体在省域生态旅游吸引力的分析层次与职能指向,深化了生态旅游利益主体理论体系;通过动态fsQCA展示了省域生态旅游吸引力的驱动因素与路径演化,有助于为各省域精准施策以增强生态旅游吸引力提供决策参考。
李泓沄 , 林欣芸 , 王兰兰 . 利益主体视角下省域生态旅游吸引力的驱动因素与路径演化[J]. 中国生态旅游, 2024 , 14(4) : 770 -784 . DOI: 10.12342/zgstly.20240157
Enhancing the attractiveness of ecotourism is a pivotal aspect in promoting the development of ecotourism and the realization of ecological value. This paper delves into the S-PEST-EA logic of provincial ecotourism attractiveness by elucidating the recursive relationship among “stakeholders”, “macro-environments” and “ecotourism attractiveness”. Moreover, it employs dynamic fuzzy-set Qualitative Comparative Analysis (fsQCA) to explore the driving factors and the paths evolution of ecotourism attractiveness from 2011 to 2021. The results show that: (1) ecotourism attractiveness is jointly driven by the macro-environments shaped by the government, enterprises, residents, and tourists. Specific driving factors include financial support, special fund investment, and forest coverage rate, which represent the policy environment; the number of catering and accommodation enterprises, which represent the economic environment; and the level of urbanization and the number of internet ports per capita, which represent the social and technological environment. (2) There were 13 high-level ecotourism attraction paths during the research cycle, 4 of which were typical paths and 9 of which were evolutionary paths. Among them, R1, represented by the forest coverage rate, the number of catering enterprises, the number of accommodation enterprises, the level of urbanization, and the number of internet ports per capita, demonstrates the highest explanatory power. R2, comprising financial support, special fund investment, forest coverage rate, the number of catering enterprises, the number of accommodation enterprises, and a low-level of urbanization, has the most evolutionary paths. (3) A total of 19 provincial-level regions achieved high-level ecotourism attractiveness during the research cycle. Sichuan and Hunan were the earliest to achieve it, and their paths were both R2 and its evolutionary paths; Fujian has maintained the longest continuous time, with R1 and its evolutionary paths. This paper uses the PEST model to define the analysis level and functional direction of stakeholders in the provincial ecotourism attractiveness, thereby deepens the theoretical system of ecotourism stakeholder analysis. By leveraging dynamic fsQCA, it illustrates the driving factors and the paths evolution of provincial ecotourism attractiveness, which helps to provide decision-making references to enhancing the attractiveness of ecotourism for targeted policy implementation in various provincial-level regions.
Key words: ecotourism attractiveness; paths evolution; stakeholders; PEST; S-PEST-EA; dynamic fsQCA
表1 变量测量方法与数据来源Tab. 1 Measurement methods and data source of variables |
| 变量类型 | 变量名称 | 指标名称 | 符号 | 指标含义 | 数据来源 |
|---|---|---|---|---|---|
| 结果变量 | 生态旅游吸引力 | 人均接待生态旅游人次 | Ea | 生态旅游人次/年末人口数 | 生态旅游人次取自《中国林业统计年鉴》(2011—2017年)《中国林业和草原统计年鉴》(2018—2021年),其他指标均取自《中国统计年鉴》(2012—2022年) |
| 条件变量 | 政策环境 | 财政支持力度 | Fs | 林业投资总额/地方财政支出 | |
| 专项资金投入 | Sf | 林业产业发展投资/林业投资总额 | |||
| 森林覆盖率 | Fc | 森林覆盖率 | |||
| 经济环境 | 餐饮企业数量 | lnC | 餐饮法人企业数量取对数 | ||
| 住宿企业数量 | lnA | 住宿法人企业数量取对数 | |||
| 社会与技术环境 | 城镇化水平 | Up | 年末城镇人口比重 | ||
| 人均互联网端口数 | Ip | 互联网宽带接入端口/年末人口数 |
表2 变量锚点Tab. 2 Anchor points of variables |
| 变量 | 2011—2019年 | 2018—2019年 | 2020—2021年 | ||||||||
|---|---|---|---|---|---|---|---|---|---|---|---|
| 完全隶属 | 交叉点 | 完全不隶属 | 完全隶属 | 交叉点 | 完全不隶属 | 完全隶属 | 交叉点 | 完全不隶属 | |||
| Ea | 1.779 | 1.066 | 0.509 | 3.335 | 1.530 | 1.030 | 3.388 | 1.345 | 0.648 | ||
| Fs | 3.187 | 2.208 | 1.534 | 3.038 | 2.075 | 1.380 | 2.663 | 1.845 | 1.085 | ||
| Sf | 0.254 | 0.101 | 0.027 | 0.022 | 0.003 | 0.001 | 0.128 | 0.006 | 0.001 | ||
| Fc | 0.475 | 0.352 | 0.158 | 0.497 | 0.392 | 0.152 | 0.497 | 0.392 | 0.152 | ||
| lnC | 3.137 | 2.708 | 2.384 | 3.140 | 2.790 | 2.433 | 3.203 | 2.895 | 2.398 | ||
| lnA | 2.950 | 2.717 | 2.439 | 3.015 | 2.810 | 2.478 | 3.070 | 2.895 | 2.548 | ||
| Up | 0.639 | 0.561 | 0.492 | 0.680 | 0.609 | 0.555 | 0.699 | 0.628 | 0.577 | ||
| Ip | 0.574 | 0.404 | 0.234 | 0.733 | 0.635 | 0.560 | 0.813 | 0.710 | 0.615 | ||
表3 变量描述性统计Tab. 3 Descriptive statistics of variables |
| 变量 | 2011—2019年 | 2018—2019年 | 2020—2021年 | |||||||||||
|---|---|---|---|---|---|---|---|---|---|---|---|---|---|---|
| 均值 | 标准差 | 最小值 | 最大值 | 均值 | 标准差 | 最小值 | 最大值 | 均值 | 标准差 | 最小值 | 最大值 | |||
| Ea | 1.664 | 2.091 | 0.018 | 11.990 | 2.564 | 2.552 | 0.020 | 10.840 | 2.162 | 2.127 | 0.010 | 9.180 | ||
| Fs | 3.088 | 4.416 | 0.074 | 39.700 | 2.983 | 5.239 | 0.070 | 39.700 | 2.263 | 2.169 | 0.200 | 12.410 | ||
| Sf | 0.179 | 0.211 | 0.000 | 1.487 | 0.053 | 0.124 | 0.000 | 0.545 | 0.097 | 0.168 | 0.000 | 0.659 | ||
| Fc | 0.323 | 0.179 | 0.040 | 0.668 | 0.344 | 0.183 | 0.049 | 0.668 | 0.344 | 0.183 | 0.049 | 0.668 | ||
| lnC | 2.668 | 0.566 | 0.845 | 3.643 | 2.695 | 0.578 | 1.000 | 3.640 | 2.791 | 0.578 | 1.230 | 3.760 | ||
| lnA | 2.671 | 0.365 | 1.623 | 3.450 | 2.720 | 0.378 | 1.830 | 3.450 | 2.793 | 0.384 | 1.860 | 3.520 | ||
| Up | 0.574 | 0.132 | 0.228 | 0.896 | 0.620 | 0.113 | 0.338 | 0.892 | 0.641 | 0.108 | 0.357 | 0.893 | ||
| Ip | 0.423 | 0.215 | 0.086 | 0.986 | 0.643 | 0.140 | 0.400 | 0.990 | 0.718 | 0.142 | 0.450 | 1.070 | ||
表4 单项条件必要性分析Tab. 4 Conditional variables of single condition necessity analysis |
| 高水平生态旅游吸引力 | 低水平生态旅游吸引力 | |||||||||||||||
|---|---|---|---|---|---|---|---|---|---|---|---|---|---|---|---|---|
| 2011—2019年 | 2018—2019年 | 2020—2021年 | 2011—2019年 | 2018—2019年 | 2020—2021年 | |||||||||||
| 一致性 | 覆盖度 | 一致性 | 覆盖度 | 一致性 | 覆盖度 | 一致性 | 覆盖度 | 一致性 | 覆盖度 | 一致性 | 覆盖度 | |||||
| Fs | 0.524 | 0.525 | 0.565 | 0.544 | 0.639 | 0.610 | 0.544 | 0.569 | 0.497 | 0.525 | 0.484 | 0.512 | ||||
| ~Fs | 0.570 | 0.545 | 0.507 | 0.479 | 0.488 | 0.460 | 0.547 | 0.545 | 0.569 | 0.589 | 0.631 | 0.660 | ||||
| Sf | 0.638 | 0.635 | 0.626 | 0.644 | 0.683 | 0.708 | 0.447 | 0.464 | 0.404 | 0.455 | 0.374 | 0.431 | ||||
| ~Sf | 0.460 | 0.444 | 0.470 | 0.418 | 0.451 | 0.394 | 0.648 | 0.652 | 0.684 | 0.667 | 0.746 | 0.723 | ||||
| Fc | 0.682 | 0.694 | 0.727 | 0.720 | 0.721 | 0.709 | 0.377 | 0.400 | 0.328 | 0.356 | 0.338 | 0.369 | ||||
| ~Fc | 0.410 | 0.386 | 0.349 | 0.322 | 0.358 | 0.328 | 0.712 | 0.701 | 0.742 | 0.749 | 0.733 | 0.744 | ||||
| lnC | 0.694 | 0.662 | 0.739 | 0.686 | 0.790 | 0.700 | 0.418 | 0.417 | 0.364 | 0.371 | 0.382 | 0.376 | ||||
| ~lnC | 0.388 | 0.390 | 0.322 | 0.316 | 0.295 | 0.301 | 0.660 | 0.692 | 0.691 | 0.744 | 0.695 | 0.786 | ||||
| lnA | 0.702 | 0.679 | 0.718 | 0.691 | 0.743 | 0.707 | 0.405 | 0.409 | 0.353 | 0.373 | 0.346 | 0.365 | ||||
| ~lnA | 0.389 | 0.385 | 0.348 | 0.329 | 0.333 | 0.315 | 0.682 | 0.705 | 0.707 | 0.733 | 0.723 | 0.757 | ||||
| Up | 0.630 | 0.622 | 0.516 | 0.514 | 0.549 | 0.530 | 0.465 | 0.479 | 0.542 | 0.592 | 0.543 | 0.582 | ||||
| ~Up | 0.4723 | 0.458 | 0.589 | 0.540 | 0.567 | 0.528 | 0.633 | 0.641 | 0.554 | 0.557 | 0.562 | 0.580 | ||||
| Ip | 0.681 | 0.667 | 0.532 | 0.519 | 0.548 | 0.523 | 0.405 | 0.414 | 0.530 | 0.567 | 0.552 | 0.586 | ||||
| ~Ip | 0.402 | 0.393 | 0.556 | 0.519 | 0.567 | 0.533 | 0.675 | 0.688 | 0.550 | 0.563 | 0.550 | 0.574 | ||||
注:“~”表示逻辑“非” |
表5 组合条件必要性分析Tab. 5 Necessity analysis of combined conditions |
| 条件变量 组合 | 高水平生态旅游吸引力 | 低水平生态旅游吸引力 | ||||||||||||||
|---|---|---|---|---|---|---|---|---|---|---|---|---|---|---|---|---|
| 2011—2019年 | 2018—2019年 | 2020—2021年 | 2011—2019年 | 2018—2019年 | 2020—2021年 | |||||||||||
| 一致性 | 覆盖度 | 一致性 | 覆盖度 | 一致性 | 覆盖度 | 一致性 | 覆盖度 | 一致性 | 覆盖度 | 一致性 | 覆盖度 | |||||
| Fs∗Sf | 0.756 | 0.552 | 0.807 | 0.548 | 0.860 | 0.618 | 0.690 | 0.526 | 0.605 | 0.482 | 0.6053 | 0.482 | ||||
| Sf∗Fc | 0.872 | 0.617 | 0.885 | 0.631 | 0.895 | 0.655 | 0.612 | 0.452 | 0.497 | 0.403 | 0.497 | 0.403 | ||||
| Fs∗Sf∗Fc | 0.927 | 0.572 | 0.971 | 0.573 | 0.975 | 0.590 | 0.753 | 0.485 | 0.685 | 0.460 | 0.685 | 0.460 | ||||
| lnC∗lnA | 0.758 | 0.650 | 0.799 | 0.689 | 0.831 | 0.701 | 0.474 | 0.424 | 0.388 | 0.363 | 0.388 | 0.363 | ||||
| Up∗Ip | 0.772 | 0.607 | 0.612 | 0.497 | 0.646 | 0.504 | 0.564 | 0.464 | 0.674 | 0.584 | 0.674 | 0.584 | ||||
| ~Fs∗~Sf | 0.679 | 0.482 | 0.659 | 0.443 | 0.659 | 0.443 | 0.782 | 0.579 | 0.859 | 0.605 | 0.857 | 0.639 | ||||
| ~Sf∗~Fc | 0.645 | 0.439 | 0.625 | 0.418 | 0.625 | 0.418 | 0.878 | 0.624 | 0.896 | 0.649 | 0.905 | 0.671 | ||||
| ~Fs∗~Sf∗~Fc | 0.750 | 0.462 | 0.741 | 0.444 | 0.741 | 0.444 | 0.908 | 0.584 | 0.934 | 0.607 | 0.930 | 0.618 | ||||
| ~lnC∗~lnA | 0.448 | 0.398 | 0.383 | 0.344 | 0.383 | 0.344 | 0.733 | 0.679 | 0.728 | 0.670 | 0.737 | 0.733 | ||||
| ~Up∗~Ip | 0.556 | 0.434 | 0.666 | 0.509 | 0.666 | 0.509 | 0.785 | 0.640 | 0.669 | 0.566 | 0.684 | 0.580 | ||||
表6 高水平生态旅游吸引力路径Tab. 6 Pathways to high-level ecotourism attractiveness |
| 条件变量 | 2011—2019年 | 2018—2019年 | 2020—2021年 | ||||||||||
|---|---|---|---|---|---|---|---|---|---|---|---|---|---|
| R1 | R2 | R3 | R4 | R5 | R6 | R7 | R8 | R9 | R10 | R11 | R12 | R13 | |
| Fs | ● | | | ● | ● | ● | ● | ● | | ||||
| Sf | ● | ● | | ● | | ● | ● | ● | ● | ||||
| Fc | ● | ● | | ● | ● | ● | ● | ● | ● | ● | | ● | ● |
| lnC | ● | ● | ● | | ● | ● | ● | ● | ● | ● | ● | | ● |
| lnA | ● | ● | ● | | ● | ● | ● | ● | ● | ● | ● | ● | |
| Up | ● | | ● | ● | ● | ● | | ● | | | | ● | |
| Ip | ● | ● | ● | ● | | ● | | | ● | | ● | ||
| 原始覆盖率 | 0.299 | 0.132 | 0.162 | 0.084 | 0.179 | 0.133 | 0.181 | 0.160 | 0.265 | 0.190 | 0.083 | 0.267 | 0.180 |
| 唯一覆盖率 | 0.189 | 0.067 | 0.083 | 0.048 | 0.095 | 0.043 | 0.161 | 0.043 | 0.008 | 0.097 | 0.034 | 0.007 | 0.095 |
| 结果一致性 | 0.923 | 0.860 | 0.900 | 0.898 | 0.918 | 0.883 | 0.868 | 0.923 | 0.958 | 0.936 | 0.868 | 0.943 | 0.879 |
| 总体覆盖率 | 0.501 | 0.389 | 0.591 | ||||||||||
| 总体一致性 | 0.895 | 0.919 | 0.921 | ||||||||||
注:●或●表示该条件存在,或表示该条件不存在;●或表示该条件为核心条件,●或表示该条件为辅助条件;空格表示该条件可存在亦可以不存在,表8与此同。 |
表7 案例省份路径时间分布Tab. 7 Pathways timeline distribution of case provinces |
年份 路径 | 省域 | ||||||||||||||||||
|---|---|---|---|---|---|---|---|---|---|---|---|---|---|---|---|---|---|---|---|
| 广东 | 浙江 | 福建 | 北京 | 陕西 | 湖北 | 重庆 | 湖南 | 贵州 | 四川 | 江西 | 广西 | 云南 | 江苏 | 上海 | 河南 | 安徽 | 海南 | 辽宁 | |
| 2013 | R2 | R2 | |||||||||||||||||
| 2014 | R1 | R2 | R2 | R2 | R3 | ||||||||||||||
| 2015 | R1 | R1 | R2 | R2 | R2 | R3 | |||||||||||||
| 2016 | R1 | R1 | R1 | R2 | R3 | R3 | R3 | R4 | R4 | ||||||||||
| 2017 | R1 | R1 | R1 | R2 | R2 | R2 | R3 | R3 | R3 | R3 | R4 | ||||||||
| 2018 | R1/5 | R1/5 | R1/6 | R1/5/6 | R1 | R1 | R7 | R2/7 | R2 | R3 | R3 | R3 | R4 | R4 | |||||
| 2019 | R1/5 | R1 | R1/6 | R1/5/6 | R1 | R1 | R7 | R3 | R4 | ||||||||||
| 2020 | R13 | R13 | R8 | R9/10 | R9 | R13 | R9/10 | R12 | R11 | R9/10 | R12 | ||||||||
| 2021 | R8 | R8 | R13 | R8 | R13 | R9 | R13 | R9/10 | R12 | R11 | R10 | R12 | R10 | ||||||
注:R1及其演化路径用实线外框表示,R2及其演化路径用阴影着色表示,/表示“或”,即该省份在该时段可被不同路径解释。 |
表8 低水平生态旅游吸引力路径Tab. 8 Pathways to low-level ecotourism attractiveness |
| 条件 | 2011—2019年 | 2018—2019年 | 2020—2021年 | |||||||||||||||||||||||||
|---|---|---|---|---|---|---|---|---|---|---|---|---|---|---|---|---|---|---|---|---|---|---|---|---|---|---|---|---|
| 变量 | r1 | r2 | r3 | r4 | r5 | r6 | r7 | r8 | r9 | r10 | r11 | r12 | r13 | r14 | r15 | r16 | r17 | r18 | r19 | |||||||||
| Fs | ● | | ● | | | ● | ● | | ● | | ● | | ● | | ● | | | |||||||||||
| Sf | | | | | ● | ● | | | | | | | | | | | | ● | ||||||||||
| Fc | | | ● | | | | | | ● | | | | | ● | | | | | ||||||||||
| lnC | | | | | ● | ● | | | | | ● | | | | | ● | | ● | | |||||||||
| lnA | | | | | ● | ● | | | | | ● | | | | | ● | | ● | | |||||||||
| Up | | | ● | ● | ● | | | | ● | ● | ● | | ● | ● | ● | | | |||||||||||
| Ip | | ● | | ● | ● | ● | | | ● | ● | ● | | | ● | ||||||||||||||
| 原始 覆盖率 | 0.251 | 0.210 | 0.129 | 0.137 | 0.106 | 0.094 | 0.093 | 0.214 | 0.182 | 0.152 | 0.077 | 0.095 | 0.227 | 0.204 | 0.092 | 0.071 | 0.145 | 0.069 | 0.106 | |||||||||
| 唯一 覆盖率 | 0.079 | 0.056 | 0.058 | 0.028 | 0.025 | 0.051 | 0.052 | 0.053 | 0.017 | 0.085 | 0.029 | 0.066 | 0.055 | 0.035 | 0.048 | 0.032 | 0.073 | 0.021 | 0.059 | |||||||||
| 结果 一致性 | 0.879 | 0.970 | 0.873 | 0.919 | 0.892 | 0.814 | 0.840 | 0.907 | 0.855 | 0.984 | 0.926 | 0.909 | 0.923 | 0.915 | 0.943 | 0.983 | 0.984 | 0.914 | 0.899 | |||||||||
| 总体 覆盖率 | 0.588 | 0.426 | 0.519 | |||||||||||||||||||||||||
| 总体 一致性 | 0.874 | 0.900 | 0.933 | |||||||||||||||||||||||||
真诚感谢评审专家在文章的分析框架、语言表达及逻辑推理等方面提出的宝贵建议与指导,本文获益匪浅!
| [1] |
中共中央办公厅, 国务院办公厅. 关于建立健全生态产品价值实现机制的意见[EB/OL]. (2021-04-26).
[ General Office of the CPC Central Committee, General Office of the State Council. Opinions on Establishing and Improving the Realization Mechanism for the Value of Ecological Products[EB/OL]. (2021-04-26).
|
| [2] |
郭安禧, 郭英之, 孙雪飞, 等. 国外旅游目的地吸引力研究述评与展望[J]. 世界地理研究, 2016, 25(5): 153-166.
[
|
| [3] |
罗文利, 李冬花, 蒋伟峰, 等. 生态旅游地旅游者幸福感的影响因素及作用路径: 以武夷山风景名胜区为例[J]. 中国生态旅游, 2024, 14(2): 339-358.
[
|
| [4] |
谢彦君. 基础旅游学[M]. 4版. 北京: 商务印书馆, 2015.
[
|
| [5] |
章锦河, 苏杨, 钟林生, 等. 国家公园科学保护与生态旅游高质量发展: 理论思考与创新实践[J]. 中国生态旅游, 2022, 12(2): 189-207.
[
|
| [6] |
牛莉芹, 王紫彦, 王垚垚, 等. 基于旅游干扰的历山自然保护区游径附近森林群落生态环境承载力[J]. 自然资源学报, 2023, 38(4): 995-1009.
[
|
| [7] |
朱春雨, 曹建生. 生态旅游研究进展与展望[J]. 中国生态农业学报(中英文), 2022, 30(10): 1698-1708.
[
|
| [8] |
刘雪梅, 保继刚. 从利益相关者角度剖析国内外生态旅游实践的变形[J]. 生态学杂志, 2005, 24(3): 348-353.
[
|
| [9] |
王瑾, 张玉钧, 石玲. 可持续生计目标下的生态旅游发展模式: 以河北白洋淀湿地自然保护区王家寨社区为例[J]. 生态学报, 2014, 34(9): 2388-2400.
[
|
| [10] |
陈海鹰, 曾小红. 利益相关者视角的乡村生态旅游社区参与模式探讨: 以海口龙鳞村为例[J]. 广东农业科学, 2011, 38(14): 157-160.
[
|
| [11] |
张志恒, 陈兴鹏, 冯会会, 等. 基于利益相关者理论的区域生态旅游发展路径优化研究以敦煌市为例[J]. 资源开发与市场, 2016, 32(6): 749-753.
[
|
| [12] |
李维安, 王世权. 利益相关者治理理论研究脉络及其进展探析[J]. 外国经济与管理, 2007, 29(4): 10-17.
[
|
| [13] |
|
| [14] |
黄艳葵. 生态旅游利益相关者共同治理的问题分析与对策[J]. 经济研究参考, 2016(41): 97-100.
[
|
| [15] |
张红贤, 游细斌, 白伟杉, 等. 目的地旅游吸引力测算及相关因素分析[J]. 经济地理, 2018, 38(7): 199-208.
[
|
| [16] |
|
| [17] |
曾诗晴, 谢彦君, 史艳荣. 时光轴里的旅游体验: 历史文化街区日常生活的集体记忆表征及景观化凝视[J]. 旅游学刊, 2021, 36(2): 70-79.
[
|
| [18] |
|
| [19] |
|
| [20] |
陈洁. 基于PEST模型的专利情报分析方法研究: 以石墨烯为例[J]. 中国发明与专利, 2021, 18(1): 30-36.
[
|
| [21] |
张雪晶, 陈巧媛, 李华敏. 从体验对象到体验场域: 乡村旅游地高质量发展组态分析[J]. 旅游学刊, 2022, 37(5): 33-44.
[
|
| [22] |
曹文, 李德荃, 秦婷婷. 森林生态旅游业发展的利益协调机制[J]. 中国人口·资源与环境, 2014, 24(8): 100-108.
[
|
| [23] |
何海, 王亚辉. 基于TDI城市类世界知名旅游目的地旅游综合竞争力比较研究[J]. 经济地理, 2023, 43(9): 231-240.
[
|
| [24] |
张可云, 王洋志, 孙三百. 行政级别、财政支持与城市创新能力: 兼论不同区域发展战略的影响[J]. 浙江社会科学, 2021(12): 13-23, 155.
[
|
| [25] |
吴雪飞, 赵磊. 旅游业是产业结构变迁的动力吗? 来自中国的经验证据[J]. 旅游科学, 2019, 33(5): 80-103.
[
|
| [26] |
|
| [27] |
王兆峰, 霍菲菲, 徐赛. 湘鄂渝黔旅游产业与旅游环境耦合协调度变化[J]. 经济地理, 2018, 38(8): 204-213.
[
|
| [28] |
林爽, 赵磊. 城镇化进程对旅游产业竞争力的门槛效应研究[J]. 旅游学刊, 2020, 35(11): 27-41.
[
|
| [29] |
刘震, 杨勇, 眭霞芸. 互联网发展、市场活力激发与旅游经济增长: 基于空间溢出视角的分析[J]. 旅游科学, 2022, 36(2): 17-43.
[
|
| [30] |
王晓华, 白凯. 新媒体时代目的地形象的解构与重构[J]. 旅游学刊, 2018, 33(3): 1-3.
[
|
| [31] |
罗蓉, 彭楚慧, 李勇辉. 互联网使用会促进家庭旅游消费吗? 基于“两阶段消费者意愿-行为转换理论” 的分析[J]. 消费经济, 2020, 36(5): 57-67.
[
|
| [32] |
林海, 胡亚美, 陈金华. 什么决定了区域数字化发展? 基于“技术-组织-环境”(TOE)框架的联动效应分析[J]. 科技管理研究, 2022, 42(14): 24-32.
[
|
| [33] |
杜运周, 贾良定. 组态视角与定性比较分析(QCA): 管理学研究的一条新道路[J]. 管理世界, 2017, 33(6): 155-167.
[
|
| [34] |
蒙克, 魏必. 反思QCA方法的“时间盲区”: 为公共管理研究找回“时间”[J]. 中国行政管理, 2023(1): 96-104.
[
|
| [35] |
张驰, 郑晓杰, 王凤彬. 定性比较分析法在管理学构型研究中的应用: 述评与展望[J]. 外国经济与管理, 2017, 39(4): 68-83.
[
|
| [36] |
池毛毛, 杜运周, 王伟军. 组态视角与定性比较分析方法: 图书情报学实证研究的新道路[J]. 情报学报, 2021, 40(4): 424-434.
[
|
| [37] |
伯努瓦·里豪克斯, 查尔斯C. 拉金. QCA设计原理与应用: 超越定性与定量研究的新方法[M]. 杜运周, 李永发译. 北京:机械工业出版社, 2017.
[Benoît Rihoux, Charles C. Ragin. Configurational Comparative Methods: Qualitative Comparative Analysis (QCA) and Related Techniques[M]. Du Yunzhou, Li Yongfa, Trans. Beijing: China Machine Press, 2017.]
|
| [38] |
|
/
| 〈 |
|
〉 |