
The spatiotemporal pattern and evolving features of allometric relationship between regional economy and tourism development in the Yangtze River Basin
Received date: 2023-02-15
Revised date: 2023-04-06
Online published: 2023-05-25
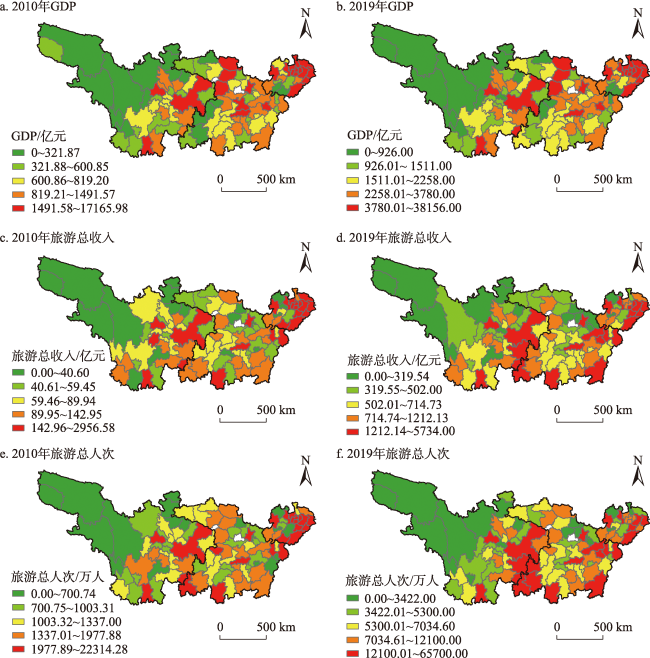
The relationship between regional economy and tourism development is a key issue in the scientific interpretation of quality tourism economic development. Taking the Yangtze River Basin as the research object, this study constructs an allometric growth model of regional economy-tourism scale and explores the spatiotemporal correlation characteristics and allometric growth level transition process of regional economy-tourism scale from 2010 to 2019 using exploratory spatial analysis methods. The results show that: (1) The regional economy and tourism scale in the Yangtze River Basin show a trend of ‘high in the southeast and low in the northwest’, and their spatiotemporal correlation indicates a temporal stability and spatial heterogeneity. There are inter-basin differences and intra-basin differences in the upper, middle and lower reaches. (2) The longitudinal (time) scale factor of the regional economy-tourism scale in the Yangtze River Basin shows a fluctuating trend of first rising and then falling. The allometric growth relationship is dominated by the regional economy growing faster than tourism. Horizontally (space), positive allometry dominates overall. The evolution of allometric growth level has the characteristics of ‘overall stability with regional fluctuations’, with greater changes in the upper and middle reaches and more stability in the lower reaches. (3) The change in allometric growth level of regional economy-tourism scale in Yangtze River Basin is mainly characterized by upward transforming from negative to positive allometry levels. Tourism development has a significant promoting effect on regional and economy for most areas. The allometric relationship between regional economy-tourism scale reveals complex internal connections between tourism and economic development, providing theoretical support for achieving high-quality development of river basin tourism economy.
Ma Xiaobin , Zhang Jinhe , Sun Yi , Zhou Leying , Wang Peijia . The spatiotemporal pattern and evolving features of allometric relationship between regional economy and tourism development in the Yangtze River Basin[J]. ECOTOURISM, 2023 , 13(2) : 237 -251 . DOI: 10.12342/zgstly.20230012
表1 长江流域上中下游城市及数量Tab. 1 Cities involved in the upper, middle and lower reaches of the Yangtze River Basin |
| 流域 | 城市 |
|---|---|
| 上游 (38个) | 重庆、成都、自贡、攀枝花、泸州、德阳、绵阳、广元、遂宁、内江、乐山、南充、眉山、宜宾、广安、达州、雅安、巴中、资阳、阿坝州、甘孜州、贵阳、遵义、毕节、昆明、曲靖、昭通、丽江、楚雄州、大理州、迪庆州、昌都、天水、陇南、玉树州、海西州、凉山州、恩施州 |
| 中游 (45个) | 南昌、景德镇、萍乡、九江、新余、鹰潭、赣州、吉安、宜春、抚州、上饶、南阳、武汉、黄石、十堰、宜昌、鄂州、荆门、孝感、荆州、黄冈、咸宁、随州、长沙、株洲、湘潭、衡阳、邵阳、岳阳、常德、张家界、益阳、郴州、永州、怀化、娄底、湘西州、桂林、铜仁、汉中、安康、商洛、襄阳、黔东南州、黔南州 |
| 下游 (20个) | 上海、南京、无锡、常州、苏州、镇江、泰州、杭州、嘉兴、湖州、合肥、芜湖、马鞍山、安庆、黄山、滁州、池州、宣城、铜陵、南通 |
表2 区域经济-旅游规模异速关系分级表Tab. 2 The classification of allometric growth relationship between regional economy and tourism scale |
| 异速增长阶段 | 异速等级 | 划分标准 | 异速关系类型 | 异速关系特征 |
|---|---|---|---|---|
| 正异速生长 | 正异速3级 | 3≤ b | 旅游规模扩张强型 | 旅游规模相对增长速度远远高于区域经济相对增长速度 |
| 正异速2级 | 1≤ b <3 | 旅游规模扩张弱型 | 旅游规模相对增长速度高于区域经济相对增长速度 | |
| 正异速1级 | 0.85≤ b <1 | 区域经济、旅游规模基本协调 | 旅游规模相对增长速度稍高于区域经济相对增长速度 | |
| 负异速生长 | 负异速1级 | 0.5≤ b <0.85 | 区域经济扩张弱型 | 旅游规模相对增长速度低于区域经济相对增长速度 |
| 负异速2级 | 0≤ b <0.5 | 区域经济扩张强型 | 旅游规模相对增长速度远远低于区域经济相对增长速度 | |
| 负异速3级 | b <0 | 区域经济、旅游规模有所收缩 | 旅游规模和区域经济其中一个减少或同时减少 |
表3 长江流域上中下游区域经济和旅游规模描述性统计Tab. 3 Descriptive statistics of regional economy and tourism scale in the sub-basins of Yangtze River Basin |
| 时间 | 指标/单位 | 统计量 | 上游 | 中游 | 下游 |
|---|---|---|---|---|---|
| 2010年 | GDP/亿元 | 最小值 | 31.86 | 242.48 | 300.84 |
| 最大值 | 7925.58 | 5565.93 | 17165.98 | ||
| 平均值 | 893.01 | 1000.59 | 3266.22 | ||
| 2010年 | 旅游总收入/亿元 | 最小值 | 0.50 | 18.03 | 22.80 |
| 最大值 | 917.85 | 750.00 | 2956.58 | ||
| 平均值 | 111.78 | 98.39 | 454.71 | ||
| 2010年 | 旅游总人次/万人次 | 最小值 | 9.65 | 285.02 | 411.41 |
| 最大值 | 16137.02 | 8942.00 | 22314.28 | ||
| 平均值 | 1614.10 | 1523.27 | 3705.44 | ||
| 2019年 | GDP/亿元 | 最小值 | 59.82 | 552.00 | 818.00 |
| 最大值 | 23606.00 | 16223.00 | 38156.00 | ||
| 平均值 | 2539.58 | 2658.95 | 7889.15 | ||
| 2019年 | 旅游总收入/亿元 | 最小值 | 9.38 | 61.09 | 212.36 |
| 最大值 | 5734.00 | 3570.79 | 4789.00 | ||
| 平均值 | 898.22 | 824.41 | 1469.53 | ||
| 2019年 | 旅游总人次/万人次 | 最小值 | 147.78 | 796.51 | 2535.09 |
| 最大值 | 65700.00 | 31898.31 | 33966.30 | ||
| 平均值 | 8169.87 | 8602.68 | 9992.26 |
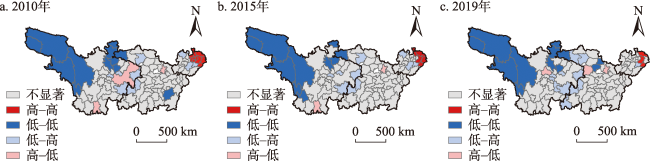
图2 长江流域区域经济和旅游规模的时空关联Fig. 2 Spatial and temporal correlation between regional economy and tourism scale in the Yangtze River Basin |
表4 上中下游间区域经济和旅游规模的时空关联Tab. 4 Spatial and temporal correlations between regional economy and tourism scale in the sub-basins of Yangtze River Basin |
| 时段 | 聚类类型 | 上游(个) | 中游(个) | 下游(个) | 占比(%) |
|---|---|---|---|---|---|
| 2010年 | 不显著 | 22 | 39 | 9 | 67.96 |
| 高-高 | 0 | 0 | 8 | 7.77 | |
| 低-低 | 10 | 2 | 0 | 11.65 | |
| 低-高 | 4 | 3 | 3 | 9.71 | |
| 高-低 | 2 | 1 | 0 | 2.91 | |
| 2015年 | 不显著 | 24 | 40 | 12 | 73.79 |
| 高-高 | 0 | 0 | 5 | 4.85 | |
| 低-低 | 9 | 1 | 0 | 9.71 | |
| 低-高 | 4 | 3 | 3 | 9.71 | |
| 高-低 | 1 | 1 | 0 | 1.94 | |
| 2019年 | 不显著 | 22 | 35 | 16 | 70.87 |
| 高-高 | 0 | 0 | 3 | 2.91 | |
| 低-低 | 9 | 3 | 0 | 11.65 | |
| 低-高 | 6 | 5 | 1 | 11.65 | |
| 高-低 | 1 | 2 | 0 | 2.91 |
表5 2010—2019年长江流域区域经济-旅游规模纵向异速增长拟合模型Tab. 5 Fitting model allometric growth between regional economy and tourism scale in the Yangtze River Basin during 2010-2019 |
| 年份 | 标度因子系数 | 拟合优度 | 异速等级 | 常数 |
|---|---|---|---|---|
| 2010 | 0.7720 | 0.8388 | 负异速1级 | -1.0372 |
| 2011 | 0.8067 | 0.8087 | 负异速1级 | -0.8164 |
| 2012 | 0.7915 | 0.8025 | 负异速1级 | -0.7469 |
| 2013 | 0.7834 | 0.8005 | 负异速1级 | -0.6671 |
| 2014 | 0.7470 | 0.8019 | 负异速1级 | -0.6749 |
| 2015 | 0.7157 | 0.7959 | 负异速1级 | -0.6288 |
| 2016 | 0.7003 | 0.7897 | 负异速1级 | -0.5409 |
| 2017 | 0.6816 | 0.7772 | 负异速1级 | -0.4397 |
| 2018 | 0.6724 | 0.7760 | 负异速1级 | -0.3394 |
| 2019 | 0.6649 | 0.7681 | 负异速1级 | -0.2789 |
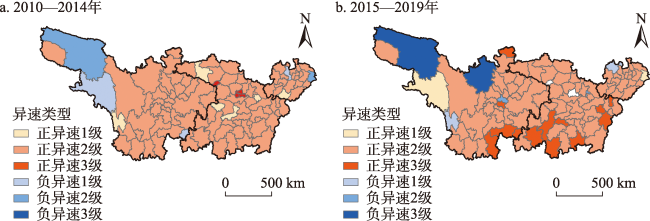
图3 2010—2014年和2015—2019年长江流域区域经济-旅游规模异速等级及其变化分布Fig. 3 Distribution of regional economy and tourism scale allometric growth in the Yangtze River Basin during 2010-2014 and 2015-2019 |
表6 长江流域上中下游区域经济—旅游规模的异速等级描述性统计Tab. 6 Descriptive statistics of regional economy and tourism scale allometric growth between sub-basins of Yangtze River Basin |
| 时段 | 异速等级 | 上游(个) | 中游(个) | 下游(个) | 占比(%) |
|---|---|---|---|---|---|
| 2010—2014年 | 负异速1级 | 2 | 0 | 1 | 2.91 |
| 负异速2级 | 1 | 0 | 1 | 1.94 | |
| 负异速3级 | 0 | 0 | 0 | 0.00 | |
| 正异速1级 | 1 | 4 | 1 | 5.83 | |
| 正异速2级 | 34 | 41 | 17 | 89.32 | |
| 正异速3级 | 0 | 0 | 0 | 0.00 | |
| 2015—2019年 | 负异速1级 | 1 | 0 | 1 | 1.94 |
| 负异速2级 | 1 | 1 | 0 | 1.94 | |
| 负异速3级 | 2 | 0 | 0 | 1.94 | |
| 正异速1级 | 1 | 0 | 1 | 1.94 | |
| 正异速2级 | 28 | 36 | 18 | 79.61 | |
| 正异速3级 | 5 | 8 | 0 | 12.62 |
表7 长江流域区域经济-旅游规模异速增长关系的跨级变动Tab. 7 Cross-sectional variation in the allometric growth between regional economy and tourism scale in the Yangtze River Basin |
| 城市 | 2010—2014年异速等级 | 2015—2019年异速等级 |
|---|---|---|
| 上海 | 负异速2级 | 正异速1级 |
| 南京 | 负异速1级 | 正异速2级 |
| 贵阳 | 负异速1级 | 正异速3级 |
| 鄂州 | 正异速2级 | 负异速2级 |
| 滁州 | 正异速2级 | 负异速1级 |
| 阿坝州 | 正异速2级 | 负异速3级 |
| 资阳 | 正异速2级 | 负异速2级 |
| [1] |
赵磊, 王佳. 中国旅游发展与经济增长: 基于省际面板数据的协整分析[J]. 旅游科学, 2015, 29(1): 40-57.
[
|
| [2] |
张大鹏, 王巧巧, 涂精华, 等. 民族地区县域旅游减贫效应研究: 基于包容性增长的视角[J]. 旅游科学, 2022, 36(2): 1-16.
[
|
| [3] |
赵磊. 国外旅游发展促进经济增长假说(TLGH)研究综述[J]. 旅游科学, 2012, 26(4): 77-95.
[
|
| [4] |
|
| [5] |
|
| [6] |
|
| [7] |
李竹, 吴卫, 王兆峰. 长江经济带旅游产业依赖对经济增长的影响及其传导机制[J]. 经济地理, 2022, 42(5): 223-232.
[
|
| [8] |
邓涛涛, 王丹丹, 刘璧如. “资源诅咒”理论在旅游研究中的应用: 综述与启示[J]. 旅游学刊, 2017, 32(11): 60-68.
[
|
| [9] |
李文静, 张朝枝. 基于路径依赖视角的旅游资源诅咒演化模型[J]. 资源科学, 2019, 41(9): 1724-1733.
[
|
| [10] |
李秋雨, 黄悦, 刘继生, 等. 广东省旅游业依赖度与经济增长关系的空间态势[J]. 经济地理, 2015, 35(5): 185-191.
[
|
| [11] |
徐春红, 丁镭, 董鸿安, 等. 浙江省旅游业发展与经济增长关系的时空格局及影响机理[J]. 旅游科学, 2017, 31(5): 82-95.
[
|
| [12] |
向富华. 乡村旅游开发: 城镇化背景下“乡村振兴”的战略选择[J]. 旅游学刊, 2018, 33(7): 16-17.
[
|
| [13] |
María,
|
| [14] |
张世兵. 湖南省入境旅游发展与经济增长的关系研究[J]. 经济地理, 2013, 33(7): 182-186.
[
|
| [15] |
陈太政, 李锋, 乔家君. 旅游产业高级化与旅游经济增长关系研究[J]. 经济地理, 2013, 33(5): 182-187.
[
|
| [16] |
|
| [17] |
张燕, 章杰宽. 旅游、经济、能源和二氧化碳排放: 基于东盟的实证分析[J]. 旅游学刊, 2021, 36(12): 26-39.
[
|
| [18] |
姬宸宇, 张含宇. 旅游业、民航业和经济增长之间的动态关系: 基于中国主要旅游城市的面板数据分析[J]. 旅游学刊, 2021, 36(12): 40-53.
[
|
| [19] |
|
| [20] |
李维航, 张高军, 陈森, 等. 粤港澳大湾区旅游竞争力与城市化的耦合协调度及其对地方经济的影响[J]. 自然资源学报, 2022, 37(3): 701-717.
[
|
| [21] |
崔丹, 李沅曦, 吴殿廷. 京津冀地区旅游经济增长的时空演化及影响因素[J]. 地理学报, 2022, 77(6): 1391-1410.
[
|
| [22] |
方创琳, 高群. 珠江流域经济带源头山区生态环境与经济协调发展[J]. 山地学报, 2002, 20(3): 296-301.
[
|
| [23] |
穆学青, 郭向阳, 明庆忠, 等. 黄河流域旅游生态安全的动态演变特征及驱动因素[J]. 地理学报, 2022, 77(3): 714-735.
[
|
| [24] |
万伦来, 朱骏锋, 沈典妹. 淮河流域经济增长与生态环境质量变化的关系: 来自1998—2007年安徽淮河流域的经验[J]. 地域研究与开发, 2009, 28(4): 125-128, 138.
[
|
| [25] |
方世敏, 黄琰. 长江经济带旅游效率与规模的时空演化及耦合协调[J]. 地理学报, 2020, 75(8): 1757-1772.
[
|
| [26] |
陈斐, 杜道生. 空间统计分析与GIS在区域经济分析中的应用[J]. 武汉大学学报(信息科学版), 2002, 27(4): 391-396.
[
|
| [27] |
梁涛, 时磊. 敏麻蜥卵形状的异速增长与卵大小和数量的权衡[J]. 生态学杂志, 2018, 37(9): 2761-2767.
[
|
| [28] |
尹上岗, 杨山, 龚海波. 长三角工业经济规模与污染排放异速关系及互动机制[J]. 地理学报, 2022, 77(9): 2202-2218.
[
|
| [29] |
许志强. 中国省域城镇土地利用集约程度分析: 基于异速增长模型[J]. 城市地理, 2016(4): 220-222.
[
|
| [30] |
李郇, 陈刚强, 许学强. 中国城市异速增长分析[J]. 地理学报, 2009, 64(4): 399-407.
[
|
| [31] |
冯兴华, 钟业喜, 李建新, 等. 长江流域区域经济差异及其成因分析[J]. 世界地理研究, 2015, 24(3): 100-109.
[
|
/
| 〈 |
|
〉 |