×
模态框(Modal)标题
在这里添加一些文本
Close
Close
Submit
Cancel
Confirm
×
模态框(Modal)标题
×
Journal
Article
Figure
Search
EN
中文
Home
About Journal
About Journal
Indexed in
Awards
Editorial Policies
Editorial Board
Guide for Authors
Instructions for Authors
Column
Browse
Current Issue
Online First
Archive
Highlights
Topic
Archive by Subject
Most Viewed
Most Download
Most Cited
E-mail Alert
RSS
Subscribe
Advertisement
Contact us
EN
中文
Figure/Table detail
Optimization of desert tourism suitable area identification model and its application in Xinjiang
Yu Hu, Chen Quanju, Wang Qi
ECOTOURISM
, 2024, 14(
3
): 666-683. DOI:
10.12342/zgstly.20240063
标度
含义
一致性检验
1
表示两个因素相比,具有相同重要性
C
R
=
C
I
R
I
C
I
=
λ
-
n
n
-
1
R
I
=
∑
m
=
1
N
C
I
m
N
=
∑
m
=
1
N
λ
m
N
-
n
n
-
1
式中:
λ
为最大特征根,
n
为唯一非零特征根,
N
为随机构造的判断矩阵数目,
C
I
为一致性指标,
R
I
为随机一致性指标,
C
R
为一致性比率。
3
表示两个因素相比,前者比后者稍重要
5
表示两个因素相比,前者比后者明显重要
7
表示两个因素相比,前者比后者强烈重要
9
表示两个因素相比,前者比后者极端重要
2,4,6,8
表示上述相邻判断的中间值
倒数
若因素
p
与因素
q
的重要性之比为
a
p
q
,
那么因素
q
与因素
p
重要性之比为
a
q
p
=1/
a
p
q
Tab. 3
Factor relative importance scales and their consistency tests
Other figure/table from this article
Tab. 1
The index system of desert tourism suitability
Tab. 2
Grading of factors’ suitability of desert tourism
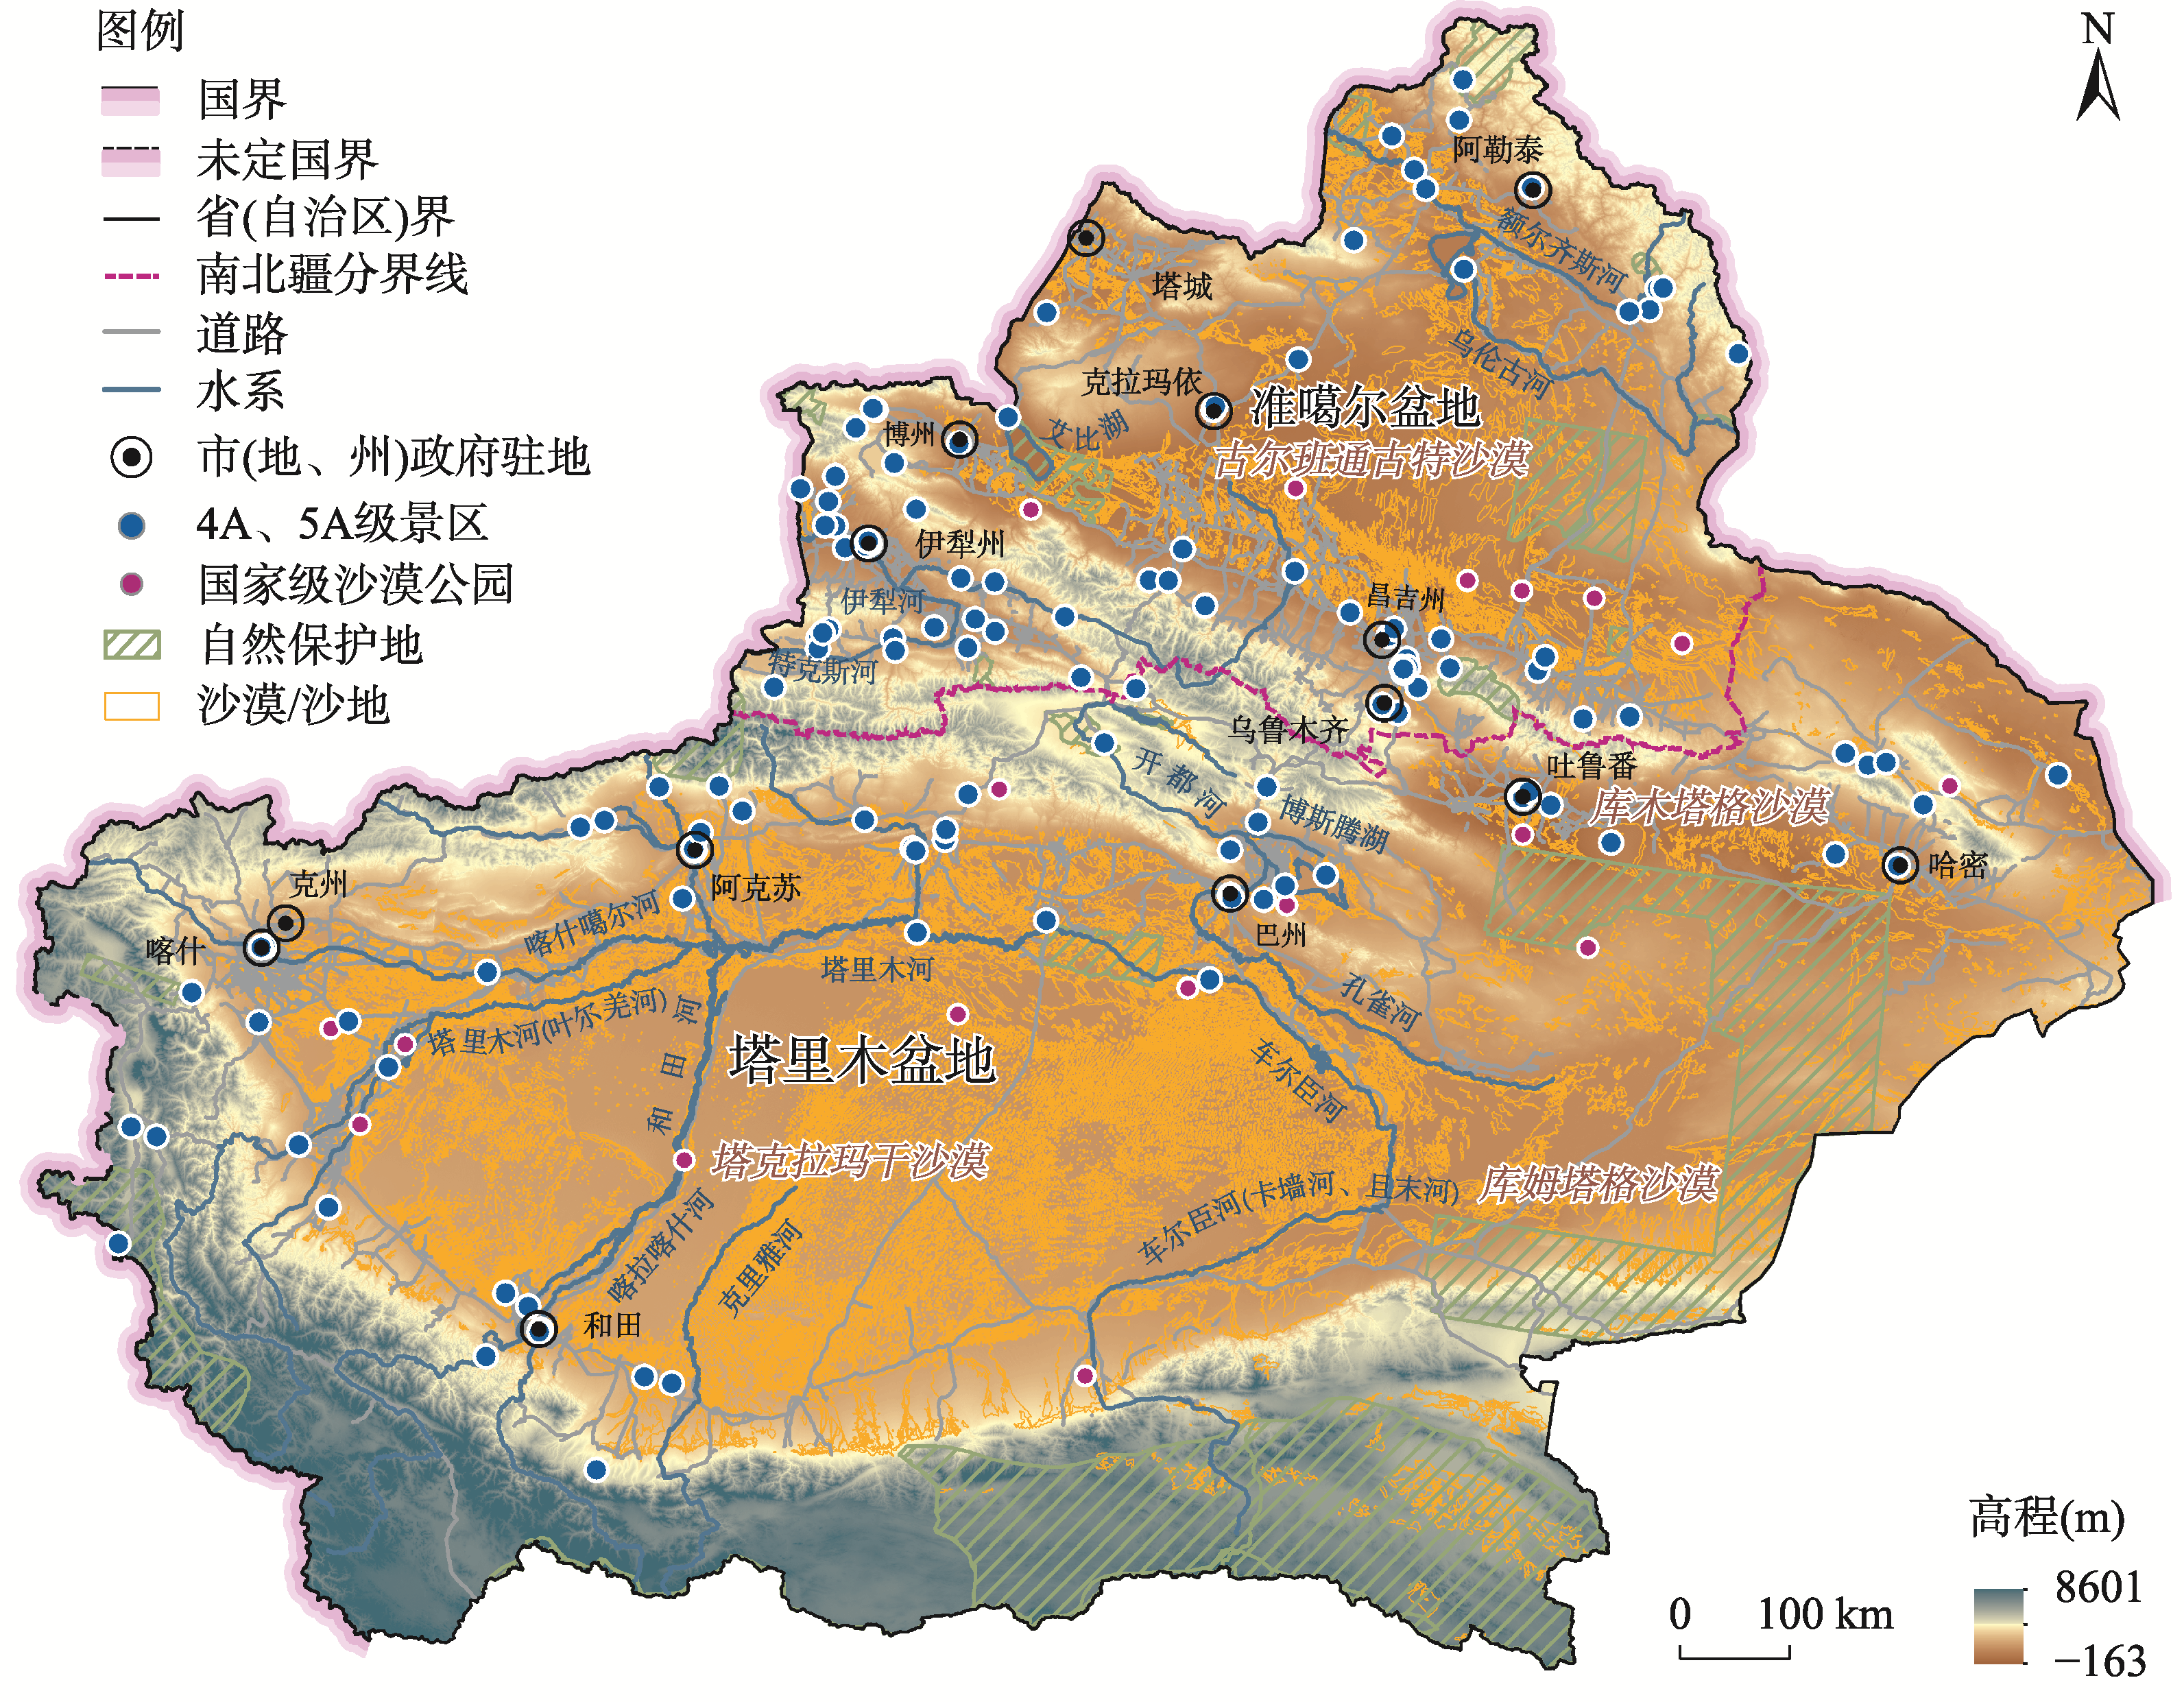
Fig. 1
The distribution of deserts in Xinjiang
Tab. 4
Expert weights for each evaluation factor
Fig. 2
Distribution and proportion of suitability scores for each factor in the criterion layer
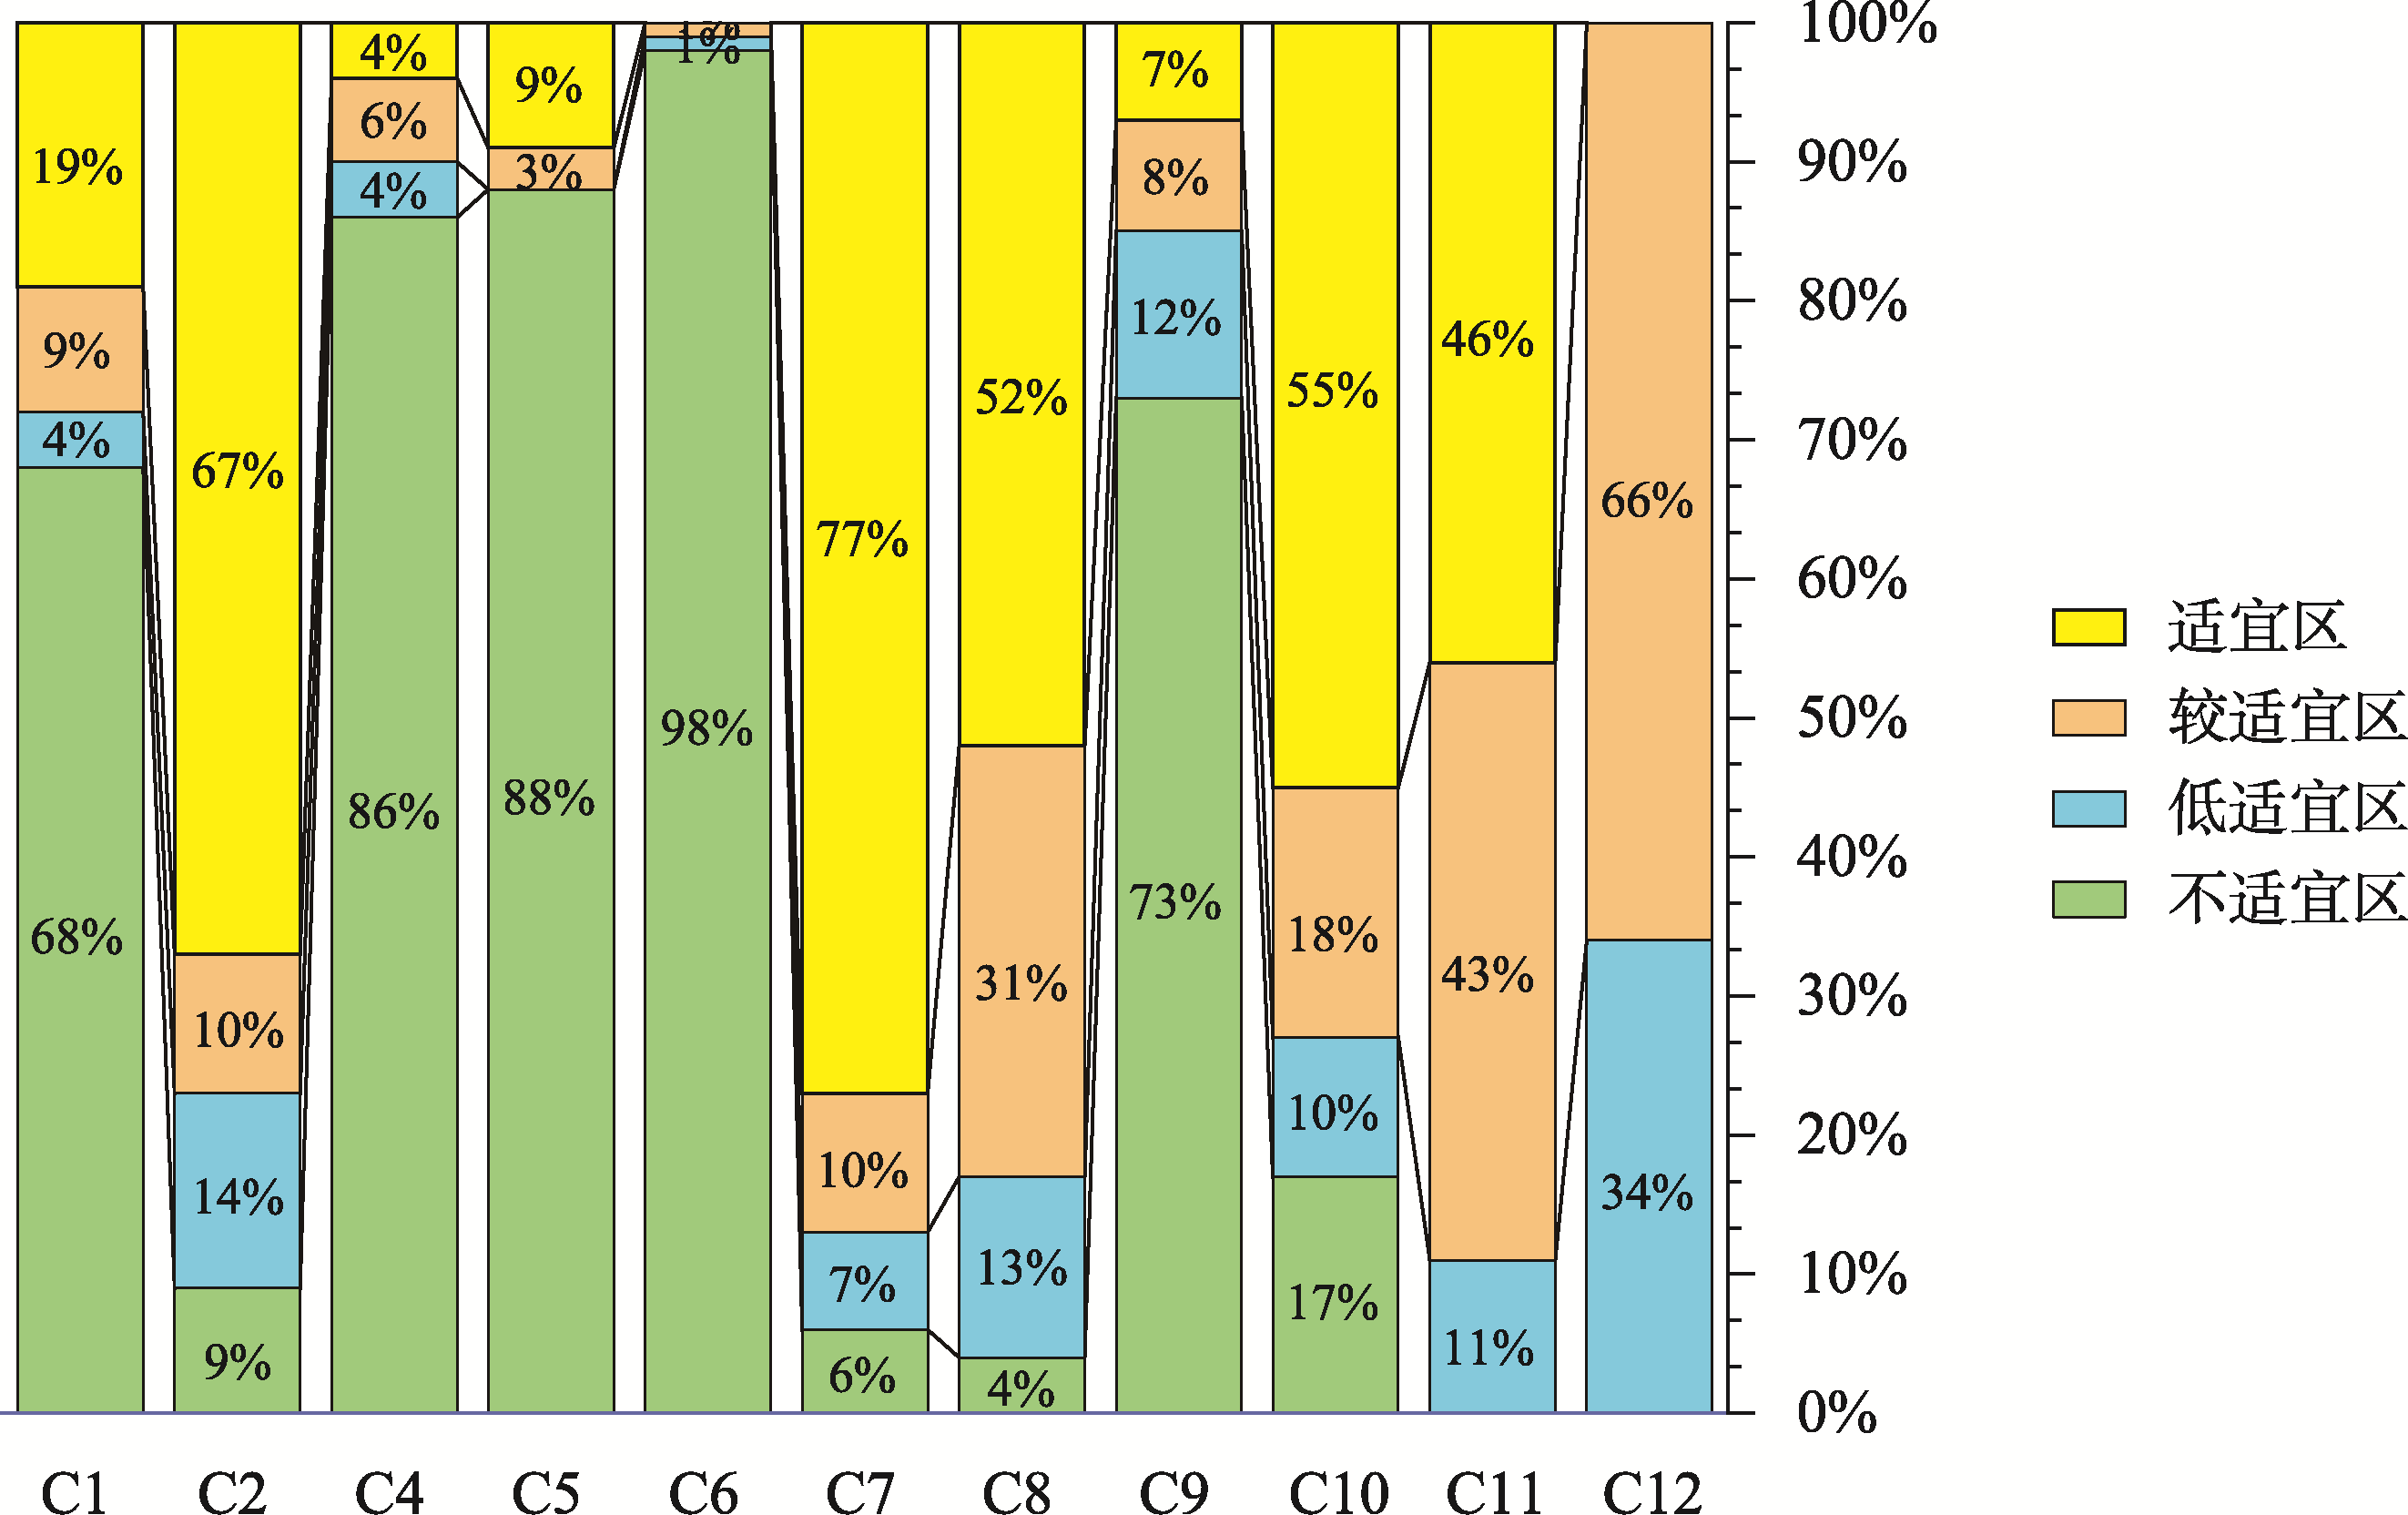
Fig. 3
Percentage of area with four categories of suitability scores for each factor
Fig. 4
Distribution of suitability scores for each evaluation factor in the indicator layer
Tab. 5
Changes in the area of each suitable area before and after the correction
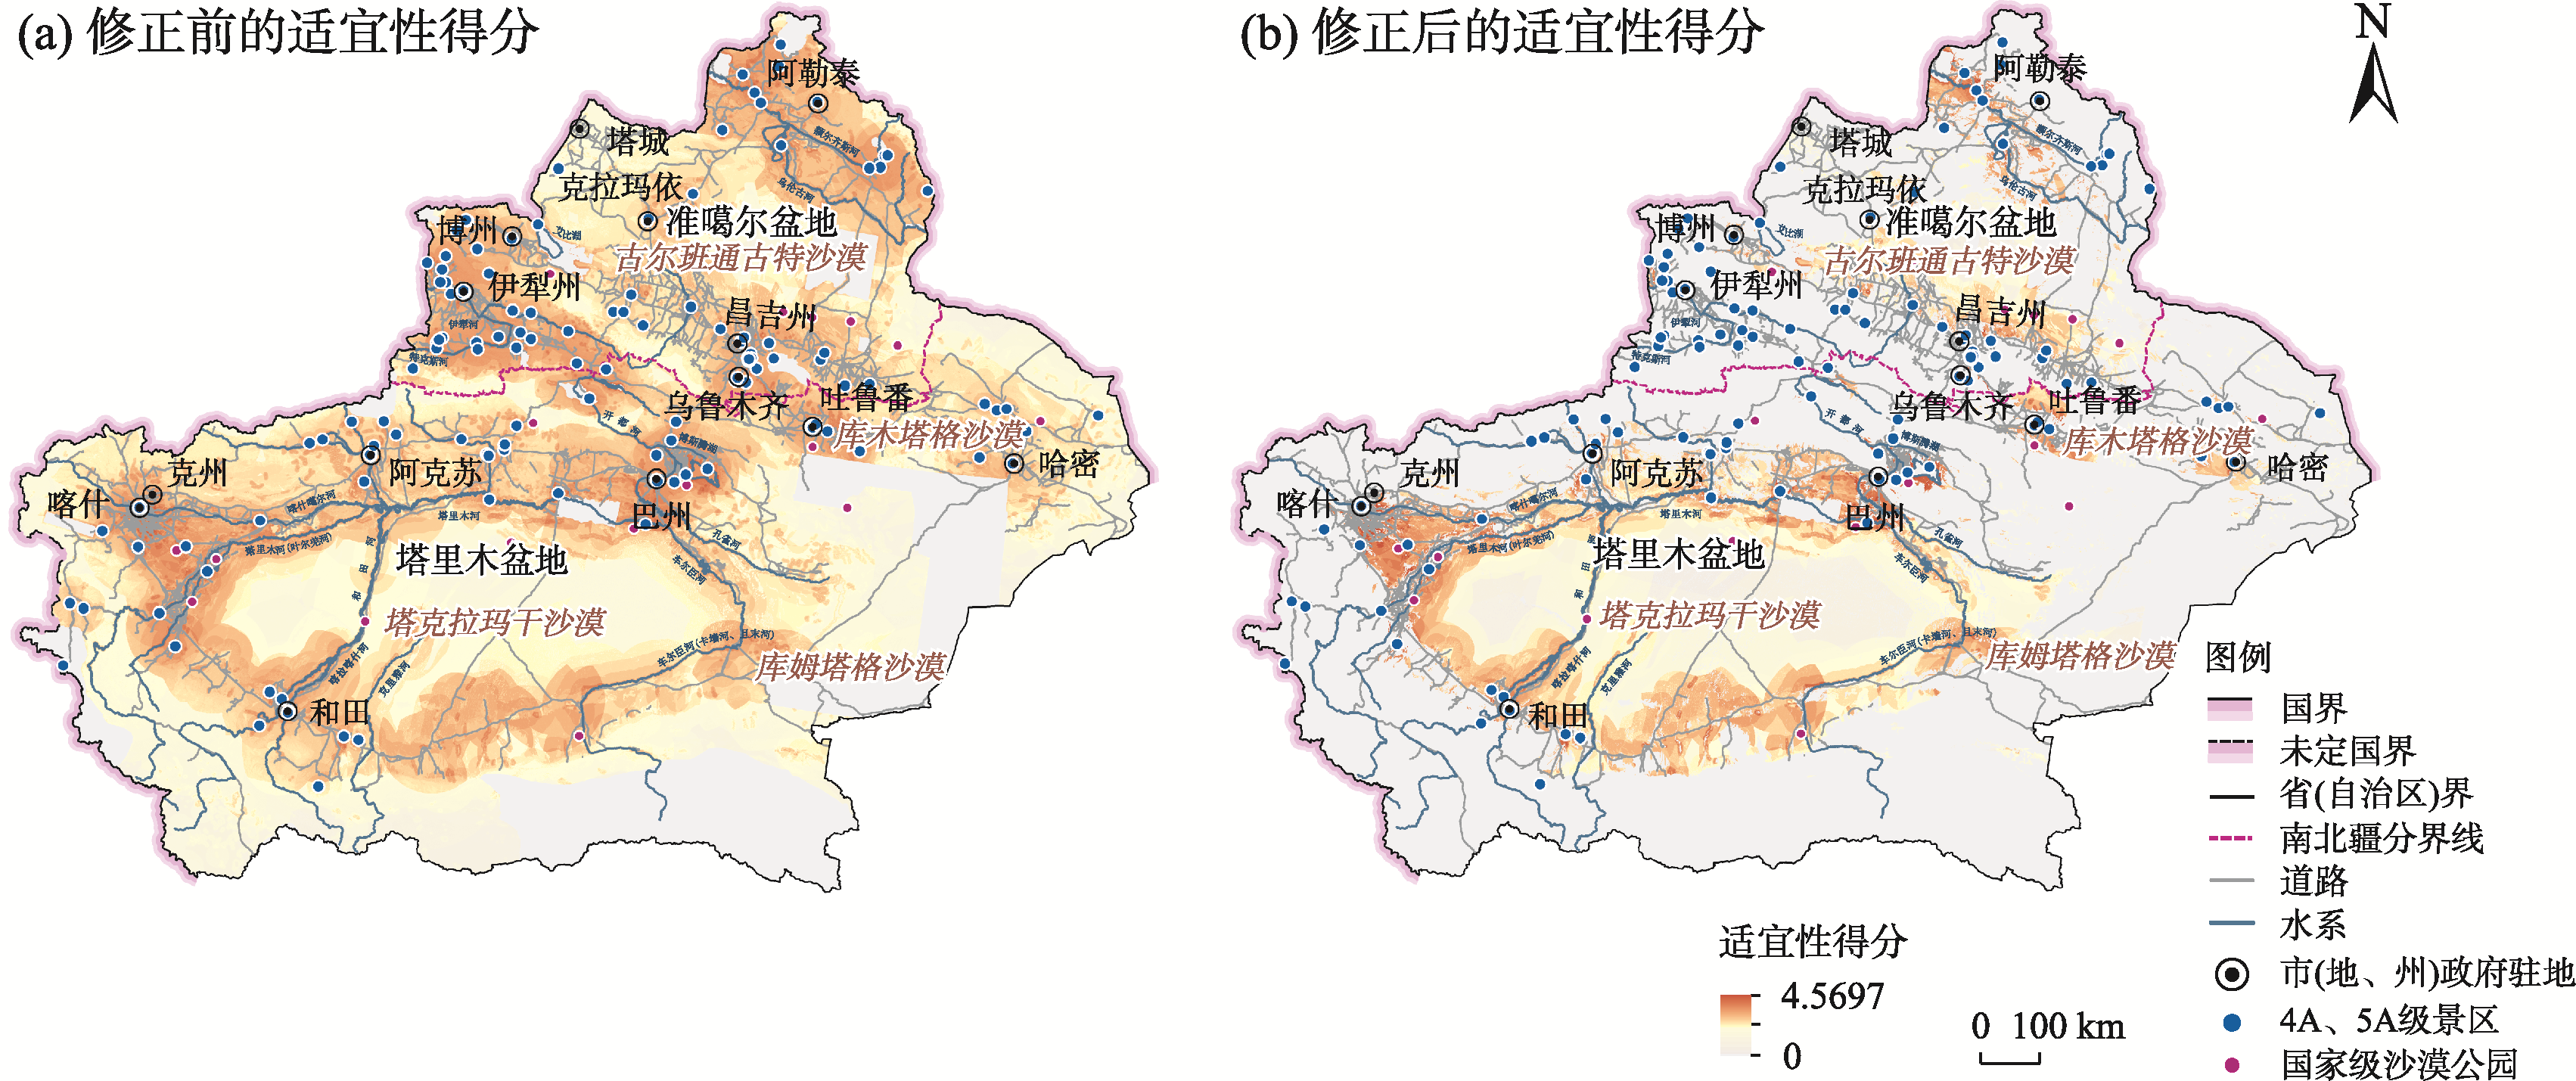
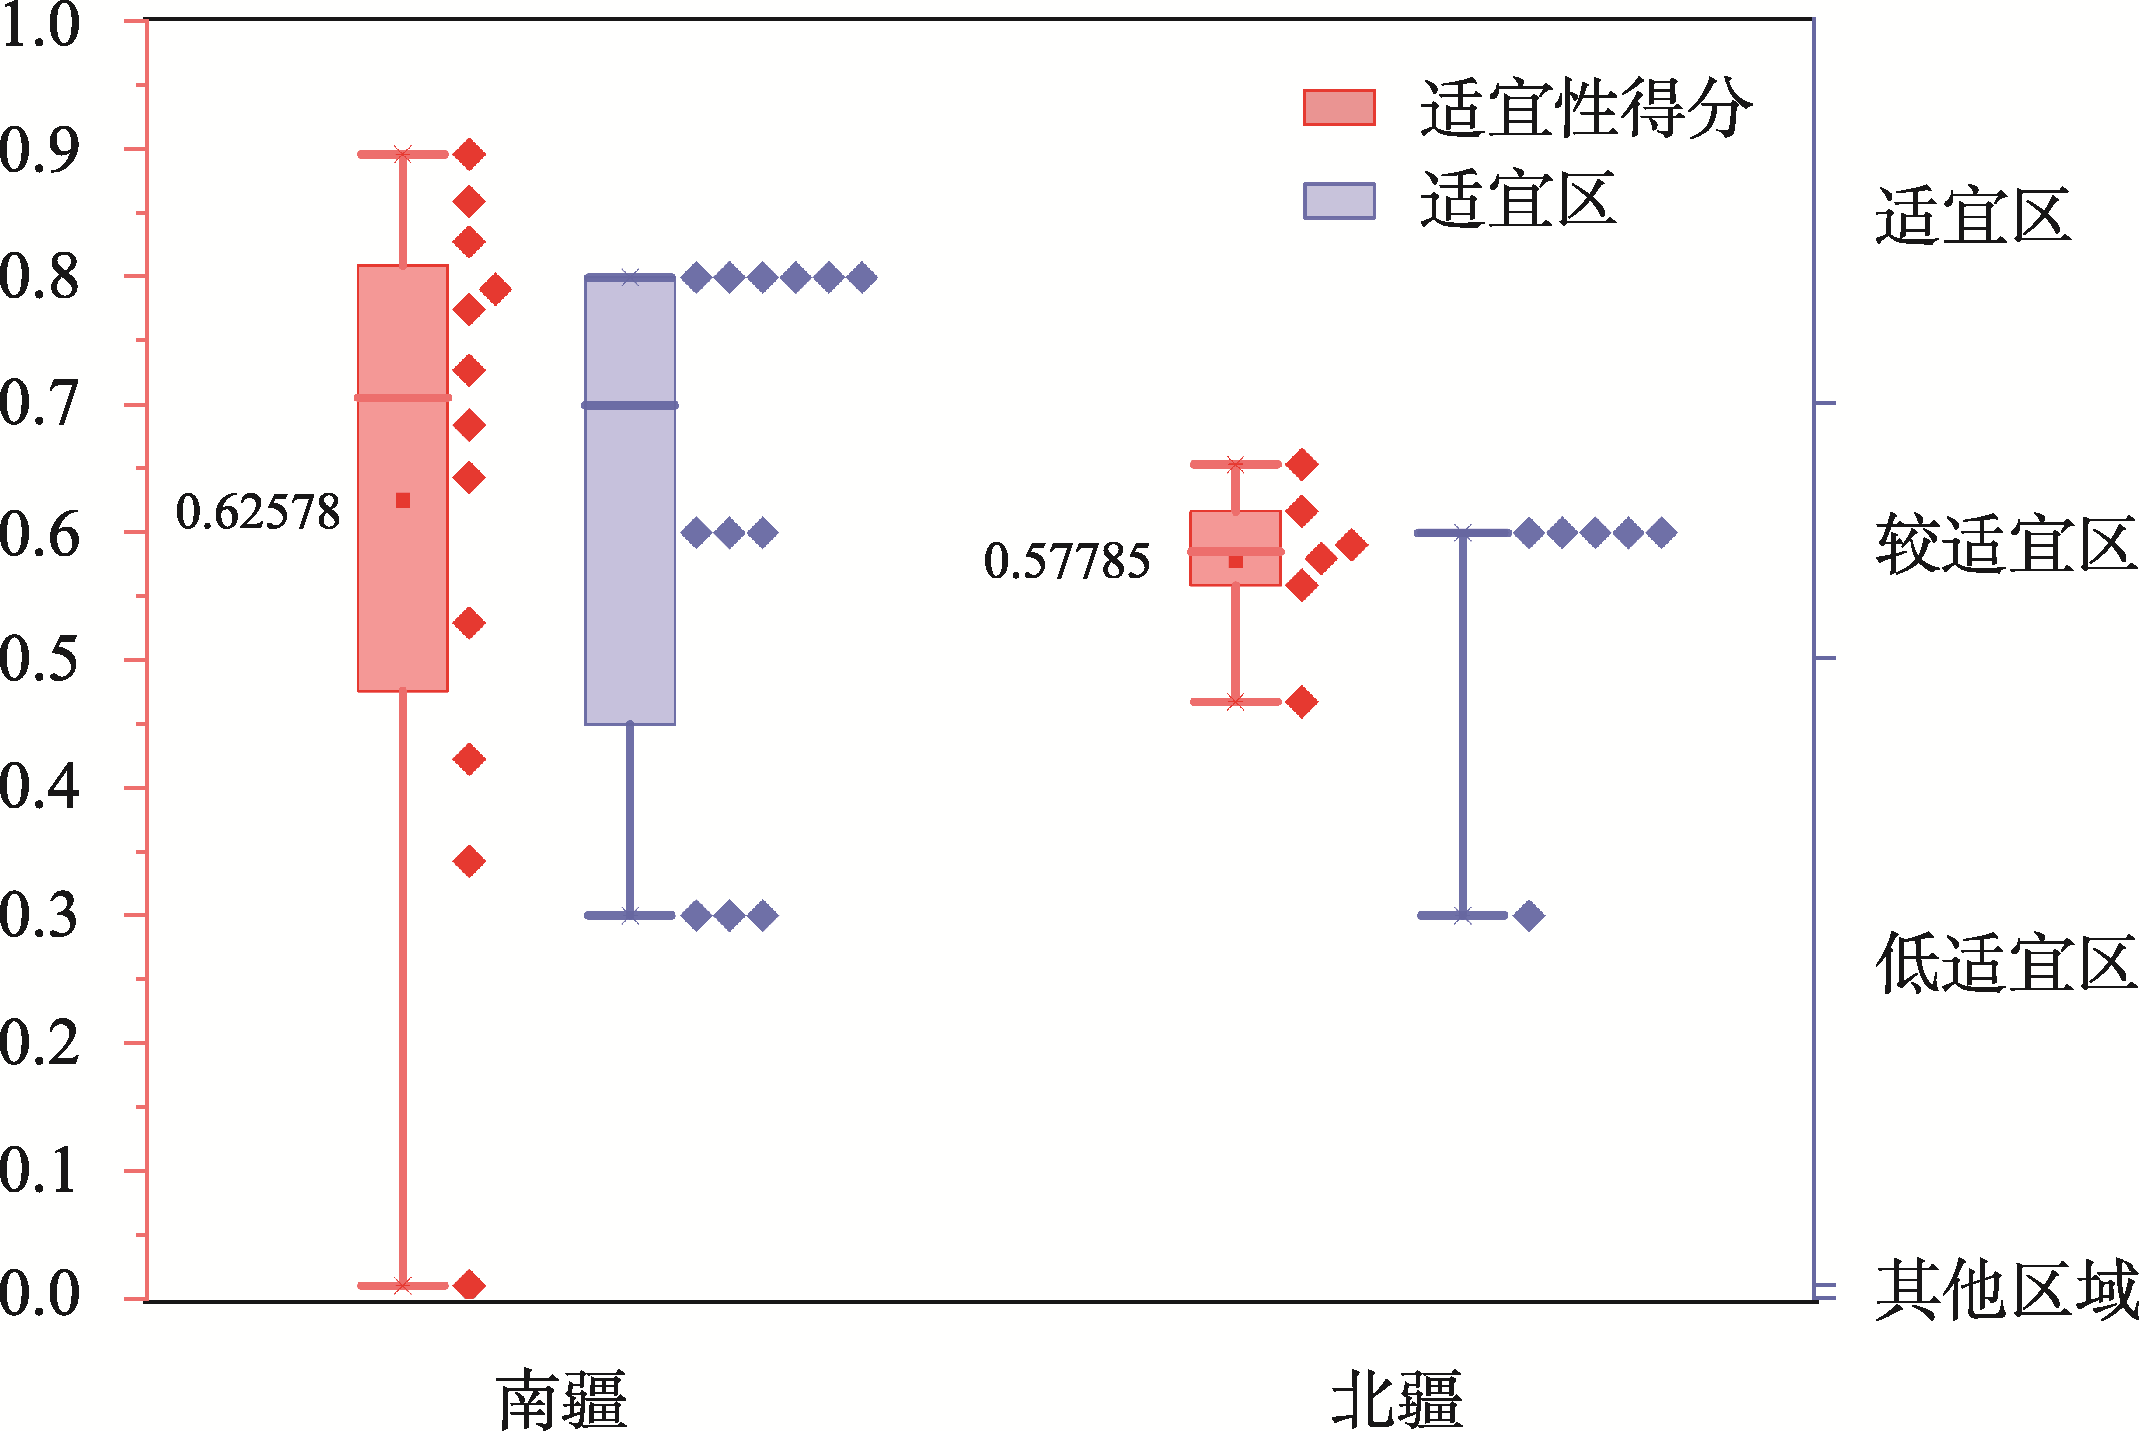
Fig. 5
Suitability scores before and after the correction
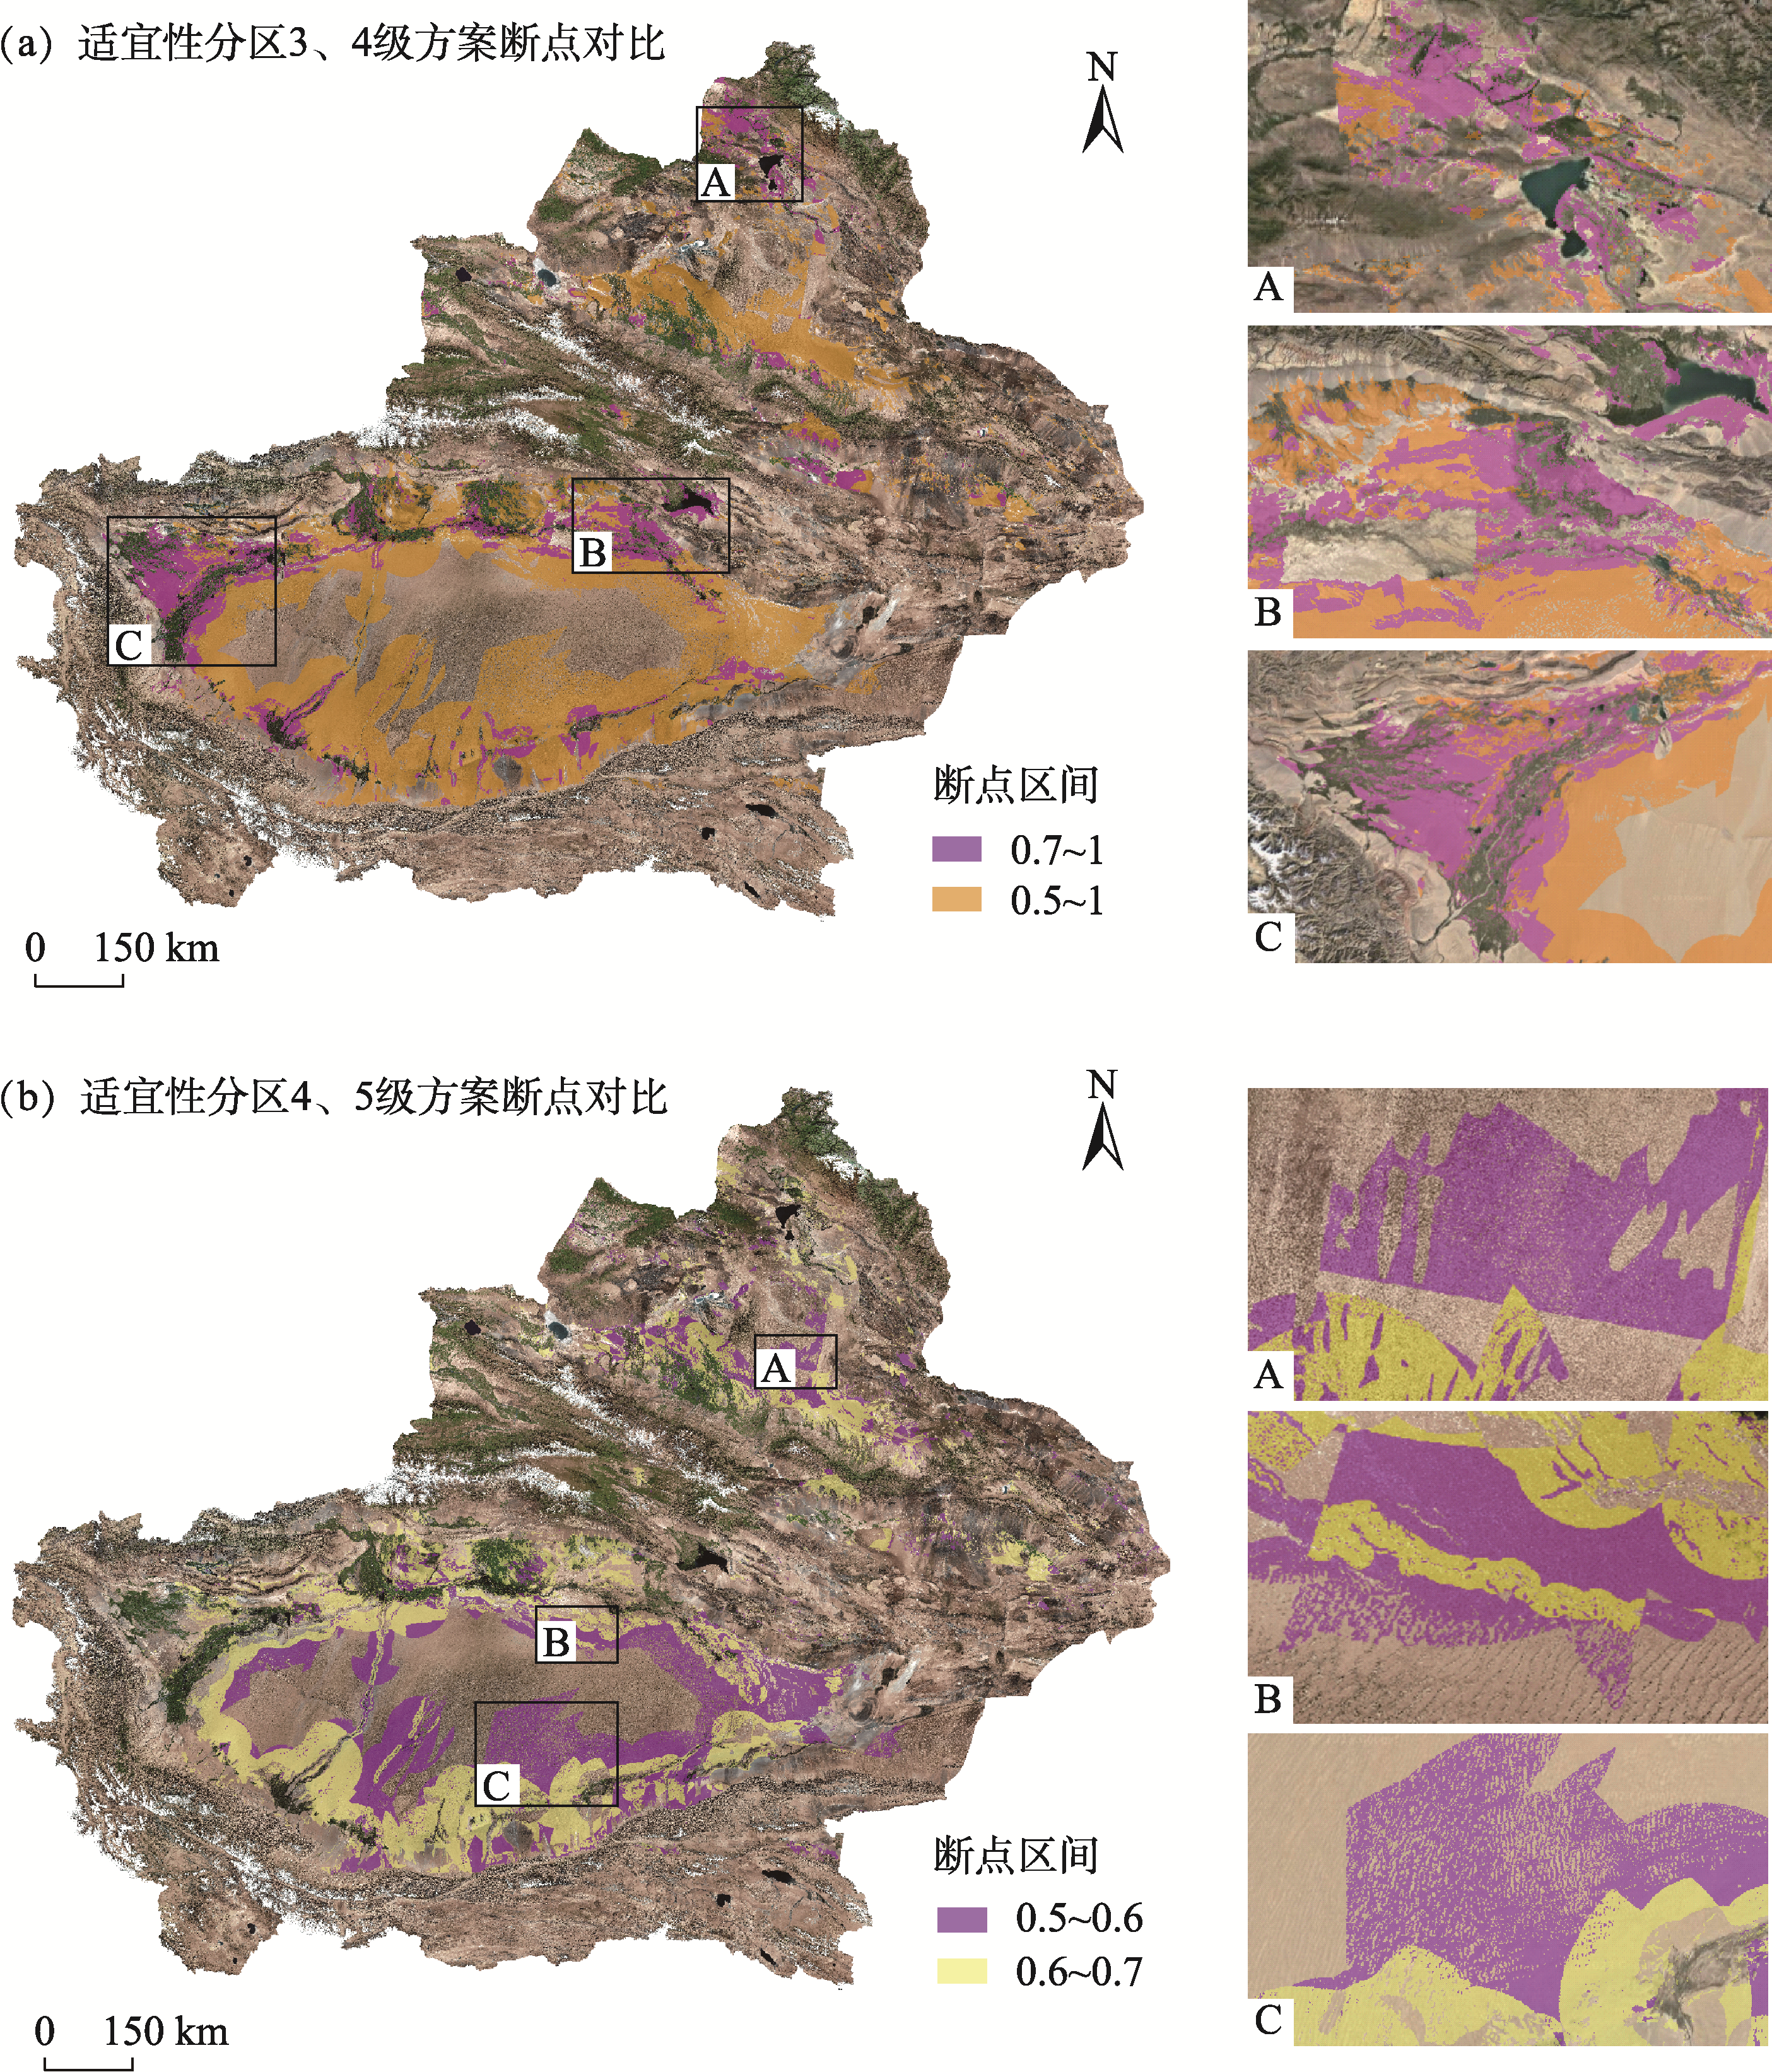
Fig. 6
Comparison of DTSA partitioning scenarios
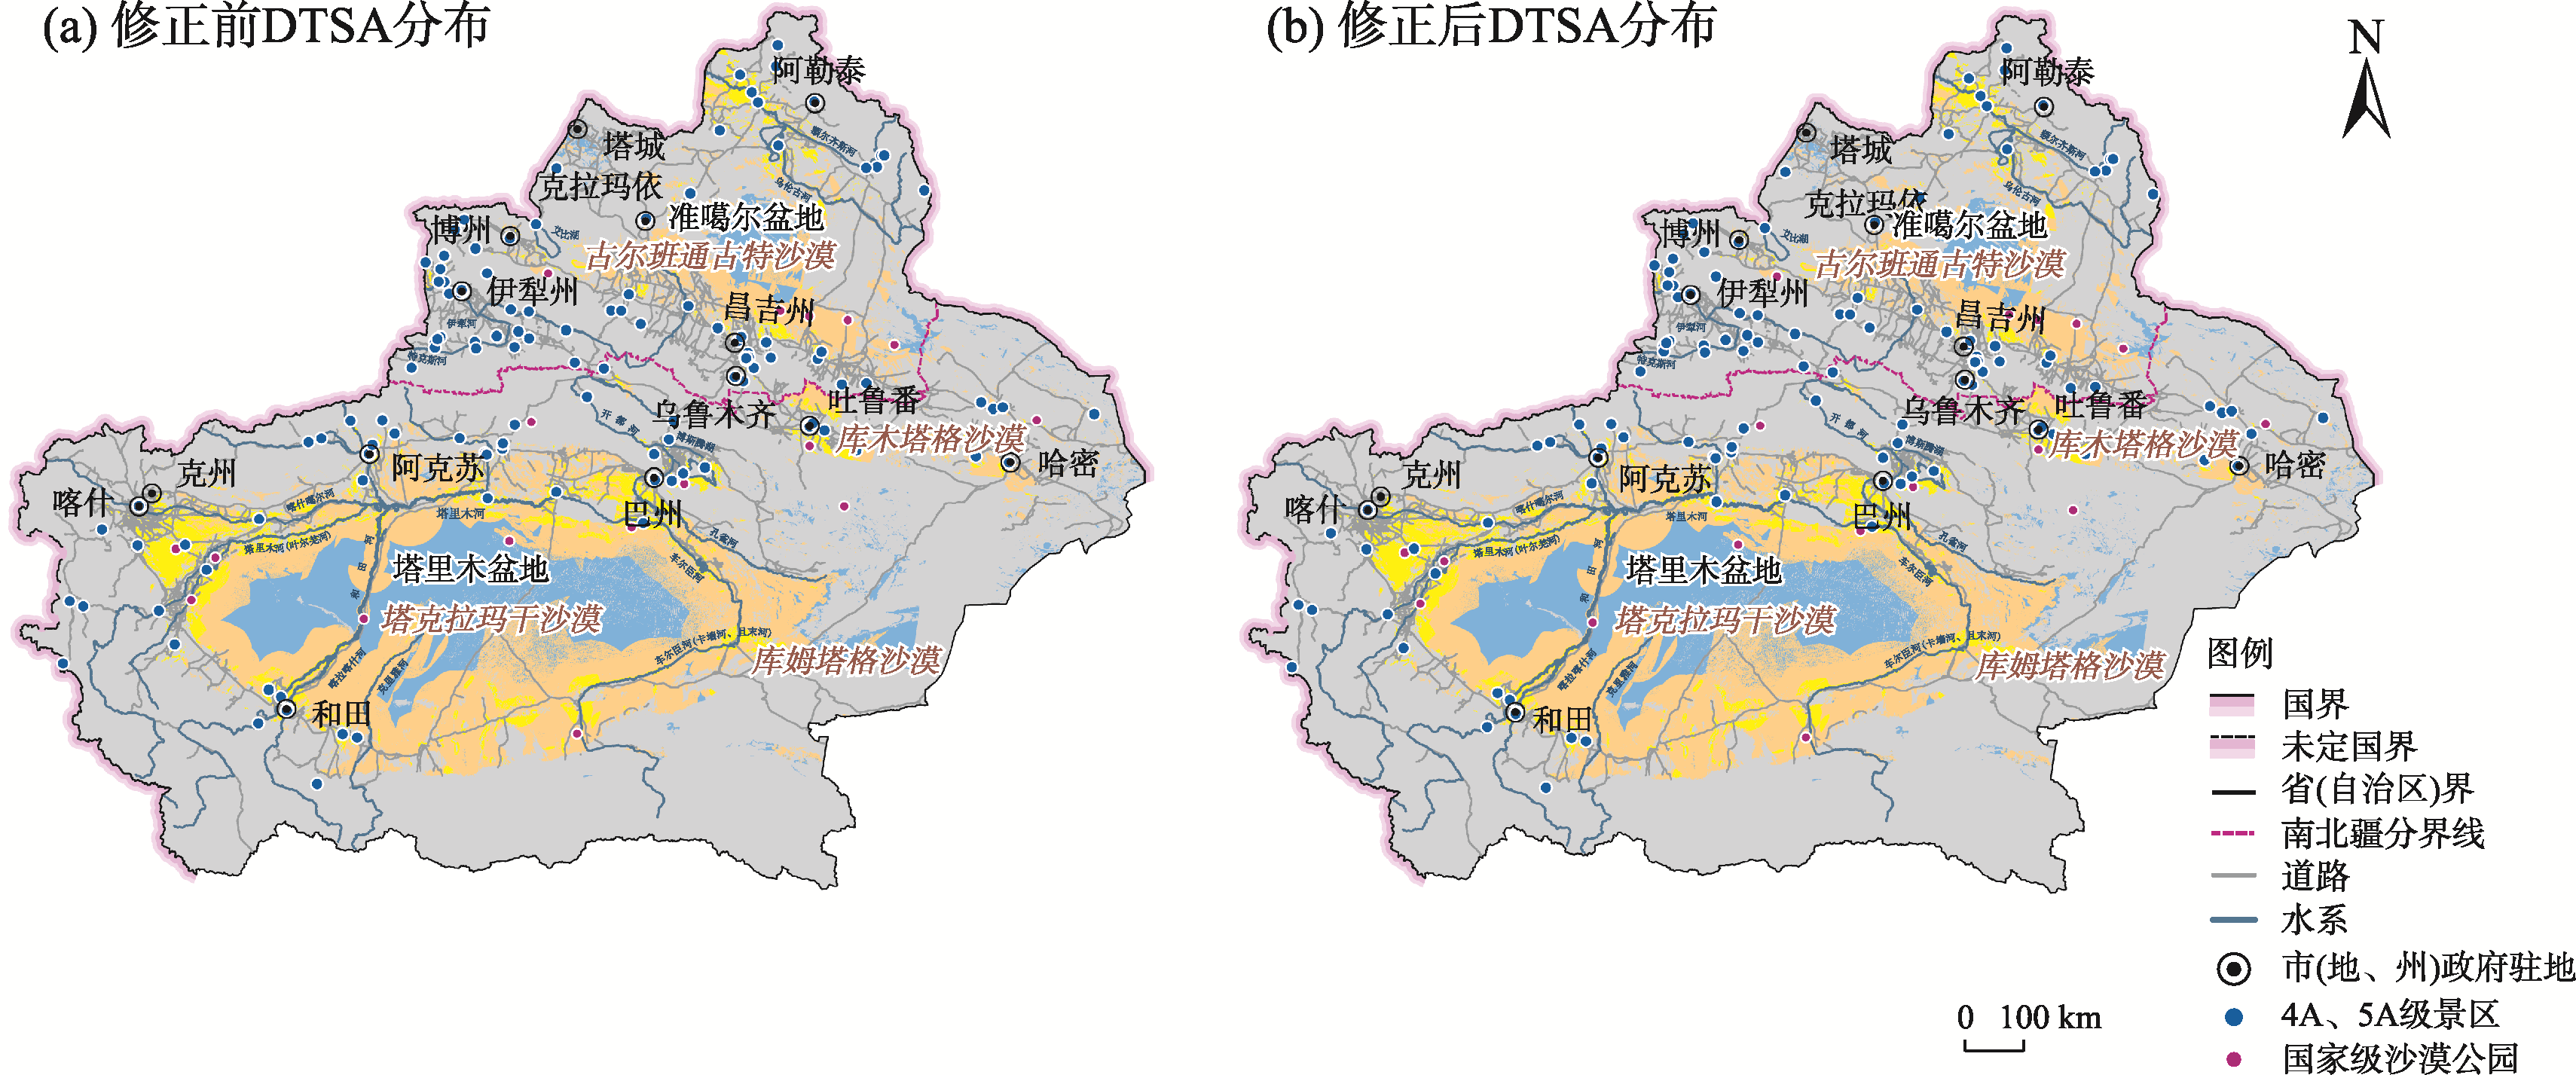
Fig. 7
Distribution of DTSA before and after the correction
Fig. 8
Validation of DTSA partitioning results